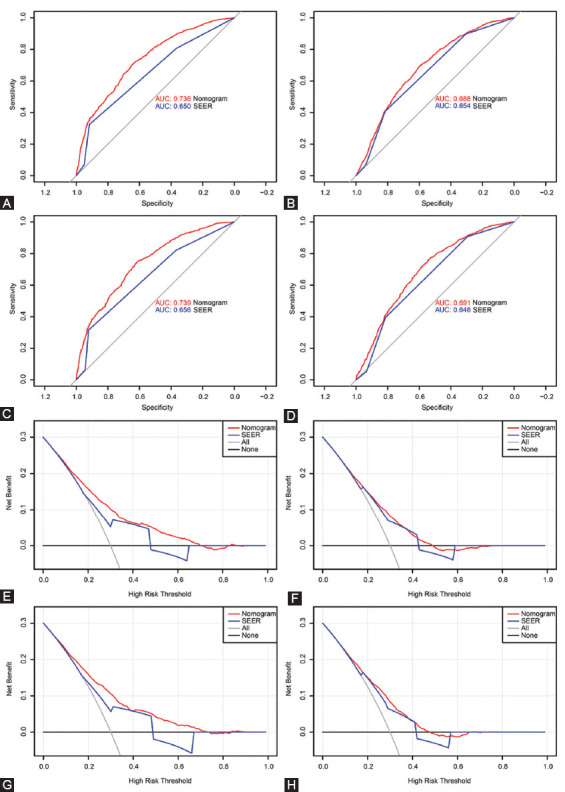
FIGURE 5.

Receiver operating characteristic (ROC) curves and decision curve analysis (DCA) curves detects the predictive value of the nomograms in the training and validation sets. A. ROC curve for overall survival (OS) in the training set; B. ROC curve for cancer-specific survival (CSS) in the training set; C. ROC curve for OS in the validation set. D. ROC curve for CSS in the validation set; E. DCA curve for OS in the training set; F. DCA curve for CSS in the training set; G. DCA curve for OS in the validation set. H. DCA curve for CSS in the validation set.
