FIGURE S1.

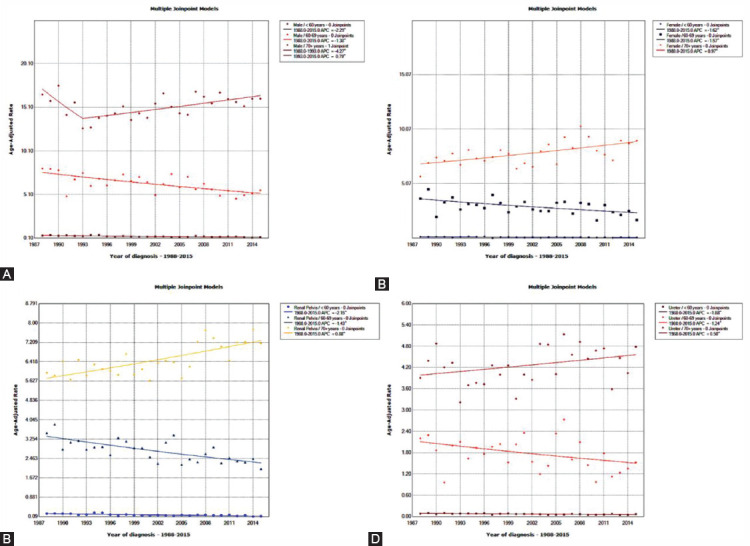
Stratified analysis of changes in the incidence of UTUC patients from 1988 to 2015. A. Grouped by sex and age; B. Grouped by primary site and age.

Stratified analysis of changes in the incidence of UTUC patients from 1988 to 2015. A. Grouped by sex and age; B. Grouped by primary site and age.