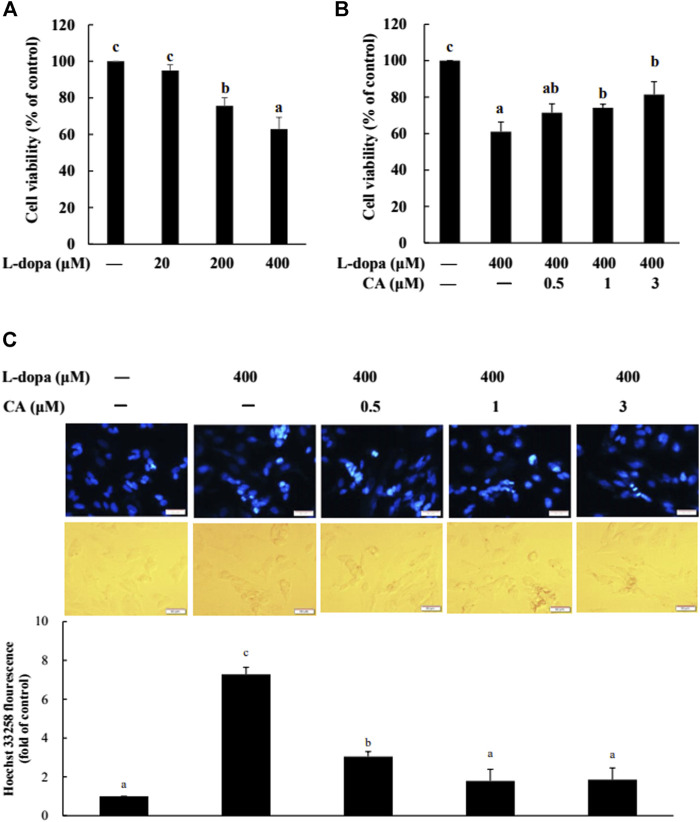
FIGURE 5.
Effect of CA on L-dopa-induced toxicity in SH-SY5Y cells. Cell viability was measured by MTT assay. (A) Cells were pretreated with 20, 200, and 400 μM L-dopa for 72 h. Control (−) was treated with PBS. (B) Cells were pretreated with 0.1% DMSO alone (−) or 0.5, 1, and 3 μM CA for 18 h and were then treated with 400 μM L-dopa for an additional 72 h. (C) Nuclei were visualized with Hoechst 33258 staining. Cells were pretreated with DMSO alone (−) or 0.5, 1, or 3 μM CA for 18 h and were then treated with 400 μM L-dopa for an additional 24 h. One representative image out of three independent experiments is shown. Values are mean ± SD (n = 3). Means not sharing a common letter are significantly different, p < 0.05.

