FIGURE 2.
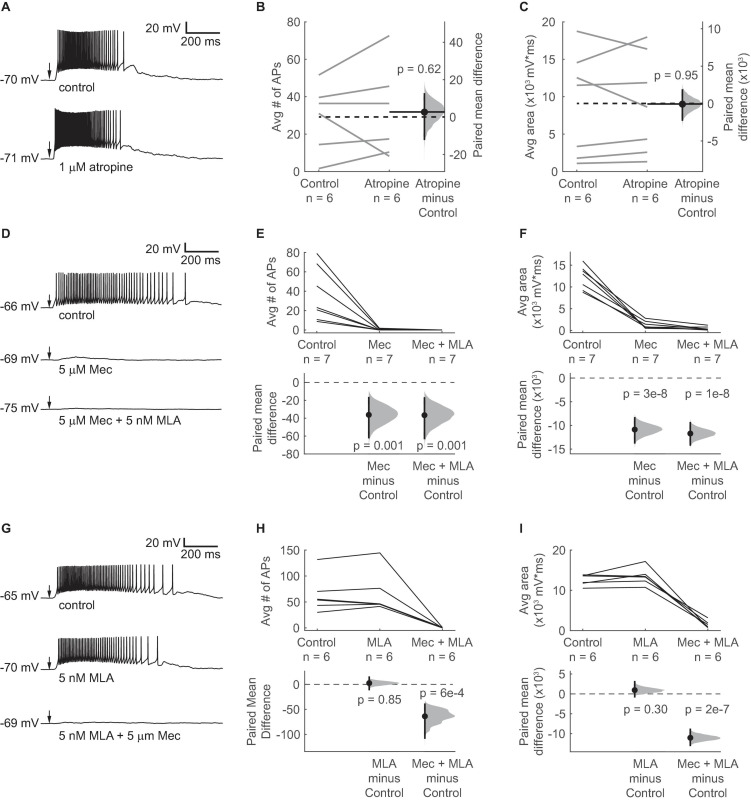
ACh-induced depolarization of VIP neurons is mediated by non-α7 nAChRs. (A) A 10 ms puff of 1 mM ACh elicited a long-lasting depolarization and spiking in a representative VIP neuron under control conditions (top). 1 μM atropine did not alter the ACh response (bottom). (B,C) Atropine did not change the average number of action potentials elicited by ACh or the average area under the median-filtered curve (spikes: paired independence test, Z = –0.486, p = 0.62, n = 6; area: paired independence test, Z = 0.086, p = 0.95, n = 6). Dashed horizontal lines show the mean of the control responses. Solid horizontal lines show the mean difference between the control and atropine conditions. Note that in all remaining experiments, 1 μM atropine was always present in the ACSF. (D) Example traces show ACh-elicited depolarization in a VIP neuron in control ACSF (top), 5 μM Mec (middle), and 5 μM Mec + 5 nM MLA (bottom). (E) Mec reduced the average number of action potentials elicited by ACh puffs from 36.6 ± 28.2 to 0.4 ± 0.7 (mean ± SD; LMM: treatment effect, F2,12 = 11.99, p = 0.001, n = 7; control vs. Mec, t12 = –4.22, p = 0.001; control vs. Mec + MLA, t12 = –4.26, p = 0.001). (F) The total depolarization elicited by ACh puffs, measured as the area under the median filtered curve, was significantly decreased by Mec and further decreased by MLA (LMM: treatment effect F2,12 = 111.6, p = 2e-8, n = 7; control vs. Mec, t12 = –12.43, p = 3e-8; control vs. Mec + MLA, t12 = –13.39, p = 1e-8). (G) When MLA was applied before Mec, MLA alone did not have a clear effect on ACh responses. From top to bottom: control, 5 nM MLA, and 5 μM Mec + 5 nM MLA. (H) The average number of action potentials elicited by ACh was not significantly affected by MLA, while subsequent application of Mec + MLA eliminated firing (LMM: treatment effect, F2,10 = 17.23, p = 6e-4, n = 6; control vs. MLA, t10 = 0.20, p = 0.85; control vs. Mec + MLA, t10 = –4.98, p = 6e-4). (I) MLA alone did not significantly alter the depolarization elicited by ACh, while subsequent application of Mec + MLA caused an 89% reduction in the average depolarization (LMM: treatment effect, F2,10 = 120.4, p = 1e-7, n = 6; control vs. MLA, t10 = 1.10, p = 0.30; control vs. Mec + MLA, t10 = –12.85, p = 2e-7). In (A,D,G) arrows indicate the time of the ACh puffs, and voltages indicate resting membrane potential. In (E,F,H,I), horizontal dashed lines indicate the level of zero mean difference, and vertical lines on the paired mean difference points indicate 95% bootstrap confidence intervals.

