FIGURE 7.
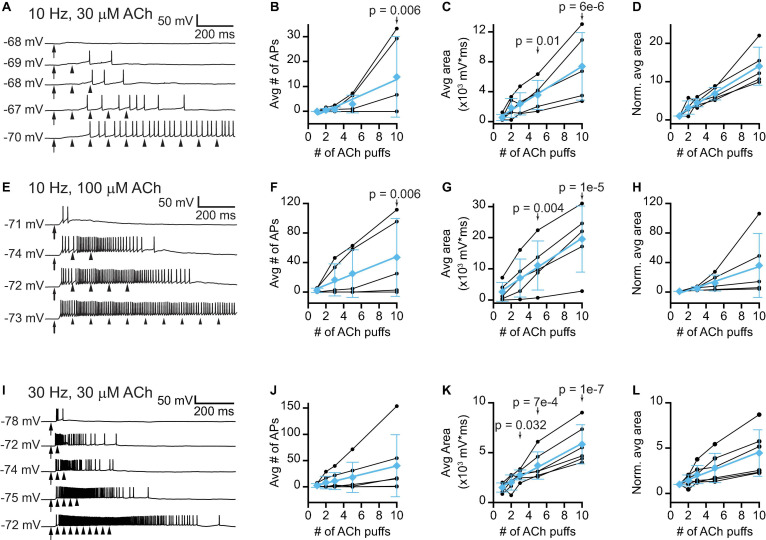
Trains of lower concentration ACh puffs elicit temporal summation and spiking in VIP neurons. (A) Example traces show that 10 Hz trains of 10 ms, 30 μM ACh puffs elicited increased depolarization and probability of firing as the train duration increased from 1 to 10 puffs (top to bottom, respectively). (B) In 3 out of 5 neurons, increasing the number of 30 μM ACh puffs led to spiking. LMM analysis of the responses of all 5 neurons revealed a significant difference in response between 10 puffs and 1 puff (LMM: treatment effect, F4,16 = 3.61, p = 0.028, n = 5; 1 puff vs. 2 puffs, t16 = 0.11, p = 0.91; 1 puff vs. 3 puffs, t16 = 0.19, p = 0.86; 1 puff vs. 5 puffs, t16 = 0.68, p = 0.51; 1 puff vs. 10 puffs, t16 = 3.19, p = 0.006). (C,D) In 5 out of 5 neurons, increasing the number of 30 μM ACh puffs progressively increased the absolute (C) or normalized (D) total depolarization, measured as the area under the median-filtered curve, indicating that temporal summation occurred (LMM of absolute values: treatment effect, F4,16 = 12.8, p = 7e-5, n = 5; 1 puff vs. 2 puffs, t16 = 1.23, p = 0.24, 1 puff vs. 3 puffs, t16 = 1.77, p = 0.10; 1 puff vs. 5 puffs, t16 = 2.92, p = 0.01; 1 puff vs. 10 puffs, t16 = 6.63, p = 6e-6). Cyan data in (B–D) show mean ± SD responses and linear fits to these means [(B), slope = 1.6 APs/puff, r = 0.97; (C), slope = 730 mV*ms/puff, r = 0.99; (D), slope = 1.4 normalized units/puff, r = 0.99]. (E) Example traces show that 10 Hz trains of 10 ms, 100 μM ACh puffs elicited increased depolarization and probability of firing as the train duration increased from 1 to 10 puffs (top to bottom, respectively). (F) In 4 out of 5 neurons, increasing the number of 100 μM ACh puffs led to spiking. LMM analysis of the responses of all 5 neurons revealed a significant difference between 10 puffs and 1 puff (LMM: treatment effect, F3,12 = 3.99, p = 0.03, n = 5; 1 puff vs. 3 puffs, t12 = 1.08, p = 0.30; 1 puff vs. 5 puffs, t12 = 1.72, p = 0.11; 1 puff vs. 10 puffs, t12 = 3.38, p = 0.006). (G,H) In 5 out of 5 neurons, increasing the number of 100 μM ACh puffs progressively increased the absolute (G) or normalized (H) total depolarization, measured as the area under the median-filtered curve, indicating that temporal summation occurred (LMM of absolute values: treatment effect, F3,12 = 18.0, p = 9.7e-5, n = 5; 1 puff vs. 3 puffs, t12 = 1.87, p = 0.09; 1 puff vs. 5 puffs, t12 = 3.54, p = 0.004; 1 puff vs. 10 puffs, t12 = 7.07, p = 1e-5). Cyan data in (F–H) show mean ± SD responses and linear fits to these means [(F), slope = 4.8 APs/puff, r = 0.99; (G), slope = 1860 mV*ms/puff, r = 0.99; (H), slope = 4.0 normalized units/puff, r = 0.99]. (I) Example traces show that 30 Hz trains of 10 ms, 30 μM ACh puffs elicited increased depolarization and probability of firing as the train duration increased from 1 to 10 puffs (top to bottom, respectively). (J) In 4 out of 6 neurons, increasing the number of 30 μM ACh puffs led to increased spiking. However, LMM analysis did not reveal a significant effect of puff number (LMM: treatment effect, F4,20 = 2.70, p = 0.06, n = 6). (K,L) In 6 out of 6 neurons, increasing the number of 30 μM ACh puffs progressively increased the absolute (K) or normalized (L) total depolarization, measured as the area under the median-filtered curve, indicating that temporal summation occurred (LMM of absolute values: treatment effect, F4,20 = 19.5, p = 1e-6, n = 6; 1 puff vs. 2 puffs, t20 = 0.92, p = 0.37; 1 puff vs. 3 puffs, t20 = 2.31, p = 0.032; 1 puff vs. 5 puffs, t20 = 4.02, p = 7e-4; 1 puff vs. 10 puffs, t20 = 7.91, p = 1e-7). Cyan data in (J–L) show mean ± SD responses and linear fits to these means [(J), slope = 4.1 APs/puff, r = 0.99; (K), slope = 480 mV*ms/puff, r = 0.99; (L), slope = 0.38 normalized units/puff, r = 0.99]. In (A,E,I) arrows and arrowheads indicate the times of ACh puffs, and voltages indicate resting membrane potential. LMM analysis was not run for the normalized data in (D,H,L) since LMM results for the non-normalized data are provided in (C,G,K).

