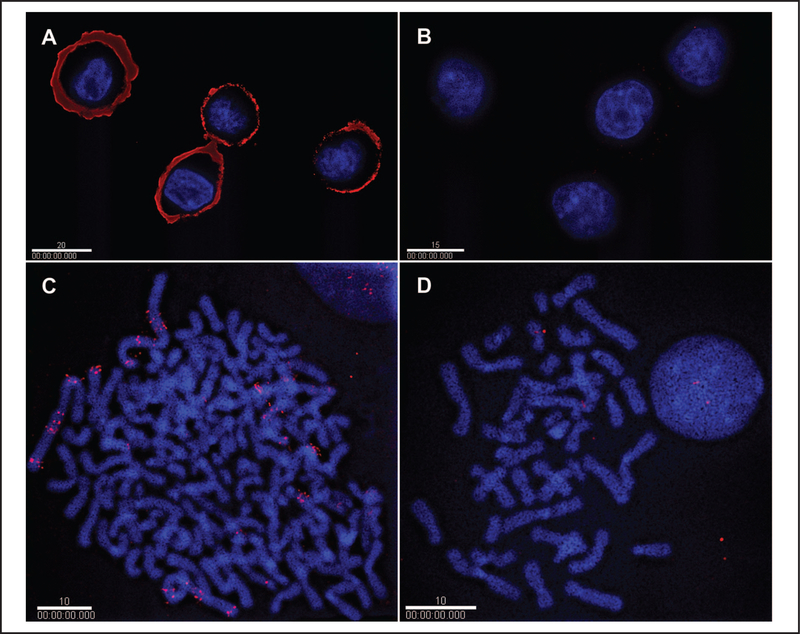
Fig. 1. IHC and FISH analyses of HER2 production and ERBB2 amplification infixed cultured cells of cell lines SK-BR-3 and MCF-7.
IHC with IgY antibody and quantum dot fluorophores for detection of HER2 production is shown for high-producing SK-BR-3 cells (A) and for very low-producing MCF-7 cells (B). FISH with the BAC CTD-2019C10 probe and quantum dot fluorophores for detecting ERBB2 amplification is shown in high copy-number SK-BR-3 cells (C) and in low copy-number MCF-7 cells (D). The white bars represent 20 μm (A), 15 μm (B), and 10 μm (C, D).

