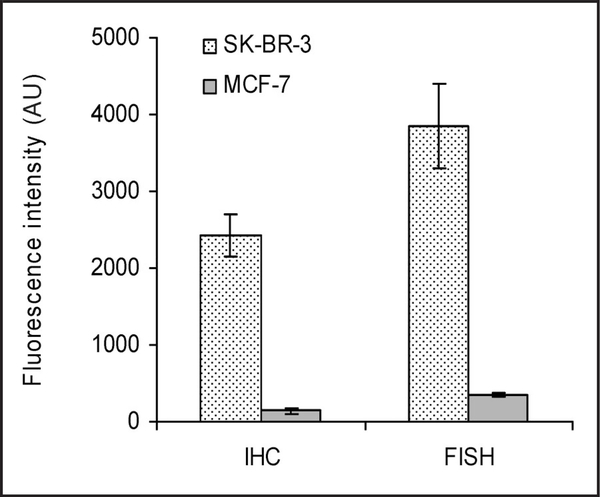
Fig. 2. Quantification of IHC and FISH images with quantum dot fluorophores.
Qdot 655–detected fluorescence was calculated for 10 randomly selected cells in the IHC and FISH experiments depicted in Fig. 1. Fluorescence intensities are expressed as the mean (SD). AU, absorbance units.

