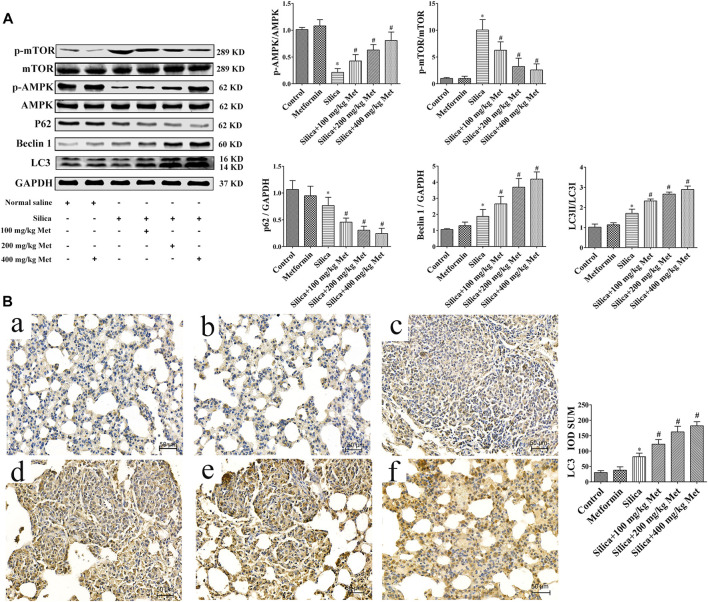
FIGURE 4.
Metformin activates autophagy via the AMPK-mTOR signaling pathway. (A) The protein levels of AMPK, p-AMPK, mTOR and p-mTOR, p62, Beclin1, and LC3 in lung tissues of rats by western blot. (B) The protein levels of LC3 was determined by Immunohistochemistry (200 × mag.). a Control group; b Metformin treatment group; c Silica group; d Silica+100 mg/kg metformin group; e Silica+200 mg/kg metformin group; f Silica+400 mg/kg metformin group. All the data are presented as mean ± SD (n = 8 for each group). *p < 0.05, compared to the negative control group; # p < 0.05, compared to silica group. AMPK, adenosine5′-monophosphate (AMP)-activated protein kinase; mTOR, mammalian Target of Rapamyc; LC3, microtubules associated protein 1 light chain 3; Met, metformin.

