Figure 6.

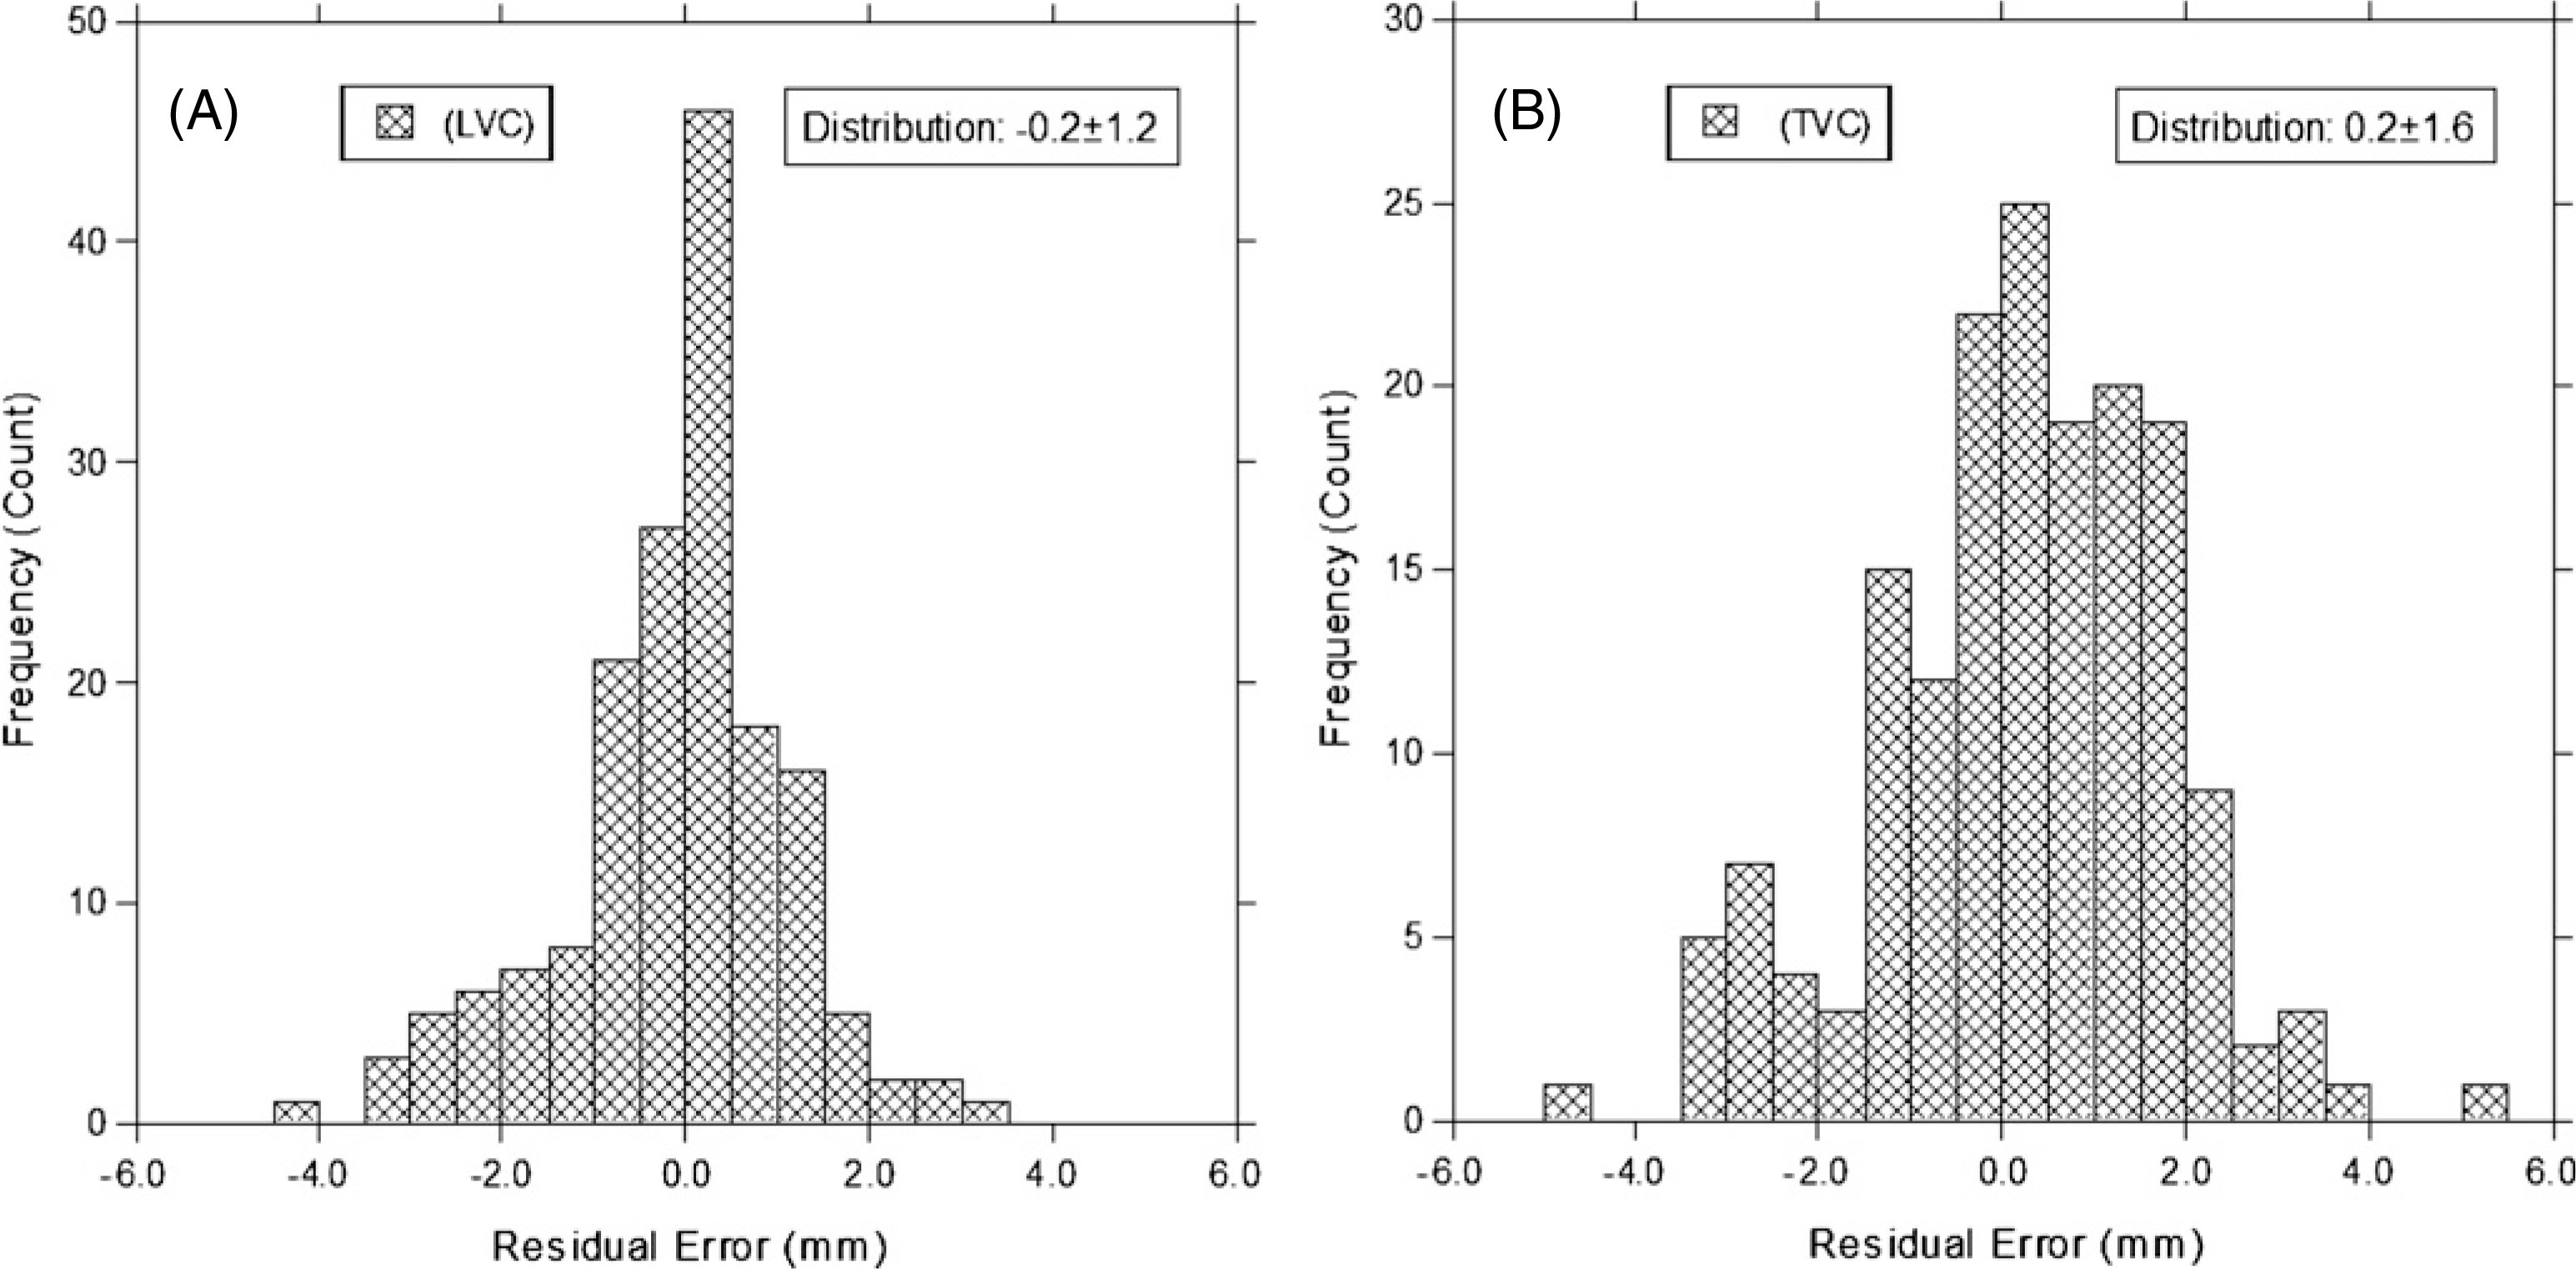
Residual error histograms (between the prediction and the measurement) for the LVC method (−0.2 ± 1.2 mm) and the TVC (0.2 ± 1.6 mm) method. The data of all respiratory stages in all patients are used in these two plots.

Residual error histograms (between the prediction and the measurement) for the LVC method (−0.2 ± 1.2 mm) and the TVC (0.2 ± 1.6 mm) method. The data of all respiratory stages in all patients are used in these two plots.