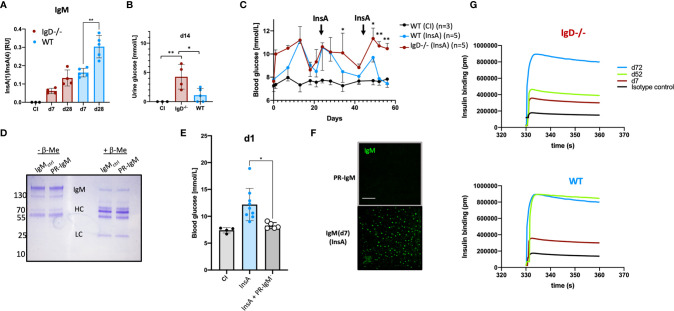
Figure 4.
The IgD-class BCR is required for affinity maturation of insulin-IgM to be protective and prevent autoimmune pathology. (A) Affinity of IgM to InsA peptides of InsA (InsA-KLH + CpG ODN1826) immunized IgD-deficient (n=4), WT (n=5) and CI (n=3) mice measured by peptide-ratio ELISA (22).Plates were coated with Streptavidin bearing one [InsA(1)] or four [InsA(4)] biotin binding sites. Mean, ± SD, statistical significance was calculated by using repeated measure ANOVA-test. (B) Urine glucose values (mmol/L) measured by commercial urine stripes (Roche) of IgD-deficient (n=4) and WT (n=5) mice immunized with InsA-KLH or CI (n=3). Mean, ± SD, statistical significance was calculated by using Kruskal-Wallis-test. (C) Blood glucose values (mmol/L) of IgD-deficient (n=4) and WT (n=5) mice immunized with InsA. Injections were done on day 0 (InsA-KLH + CpG ODN1826), day 21 (InsA-KLH), day 42 (InsA-KLH). Mean, ± SD, statistical significance was calculated by using repeated measure ANOVA-test comparing red and blue graphs. (D) Coomassie-stained SDS-PAGE showing reduced (+ β-ME) and non-reduced (- β-ME) IgM of cInsA and control immunized mice. Total serum IgM was isolated via HiTrap IgM columns (InsA d85 refers to PR-IgM). IgM monomer: 150 kD, IgM HC: 70 kD, IgM LC: 25 kD. (E) Blood glucose values (mmol/L) of IgD-deficient immunized with InsA-KLH (n=9), WT control immunized mice (n=4) and IgD-deficient mice immunized with InsA-KLH and injected with PR-IgM i.v. (n=5). Mean, ± SD, statistical significance was calculated by using Kruskal-Wallis-test. (F) Serum immunoglobulins reactive to self-molecules (DNA/RNA) of IgM (PR-IgM and day 7 primary IgM) isolated from InsA-KLH immunized mice tested via HEp2 slides. Fluorescence microscopy images are representative for three independent experiments. Scale bar: 10 µm. (G) Interferometric assay to determine the affinity of IgM to insulin. Insulin-specific isolated IgM of IgD-deficient (top panel) or WT (bottom panel) mice immunized with InsA. Affinity of IgM of different days is shown in pm. Graphs are representative of three independent experiments *P < 0.05, **P < 0.01.

