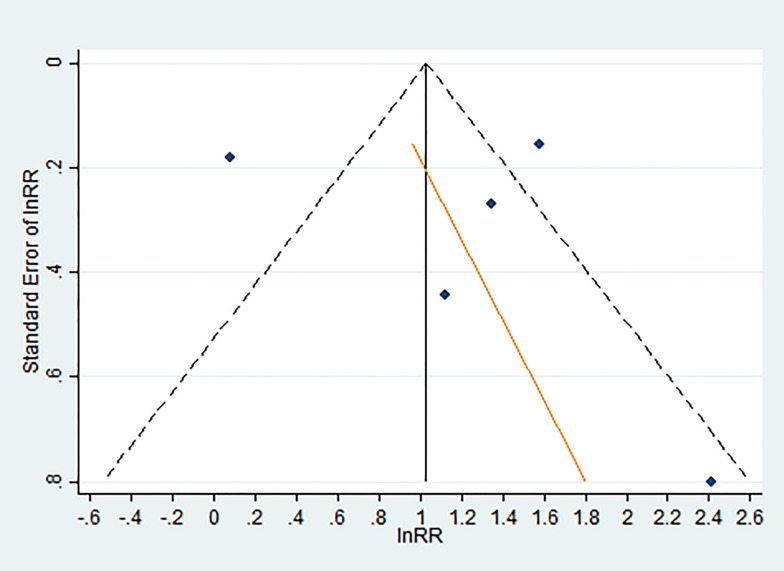
Fig. 2.
- the standard error of ln OR against the logarithmically transformed odds ratio (lnOR). In the absence of publication bias and over-dispersion (i.e. heterogeneity), the points should resemble a symmetrical inverted funnel.
- Egger's regression (in red) showing the SE plotted against the ln RR. Egger's test for funnel plot was not significant (p =0 .75).

