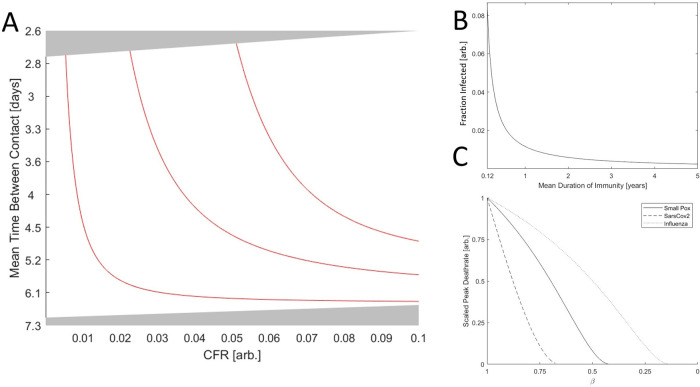
Figure 4. The role of immunity in epidemic evolution.
A. Phase diagram of a SARS-CoV-2-like virus varying CFR and contact rate. Red lines indicate the boundary between endemic equilibrium and unsustainable for α ∈ {0.01,0.045,0.08} regions corresponding to approximately {1.5,7,13} years of immunity, respectively. B. The fraction of the population infected, ( a * + c * ), vs the duration of immunity for a hypothetical virus with a CFR of zero (other parameters matching influenza and Sars-Cov-2) and the maximum admitted contact rate for endemic equilibrium. C. Peak death rate at the height of an epidemic with contact rate corresponding to the maximum value admitting endemic equilibrium given β = 1 and varying β (decreasing β corresponds to increasing isolation). Death rate is scaled by the maximum value for each virus.

