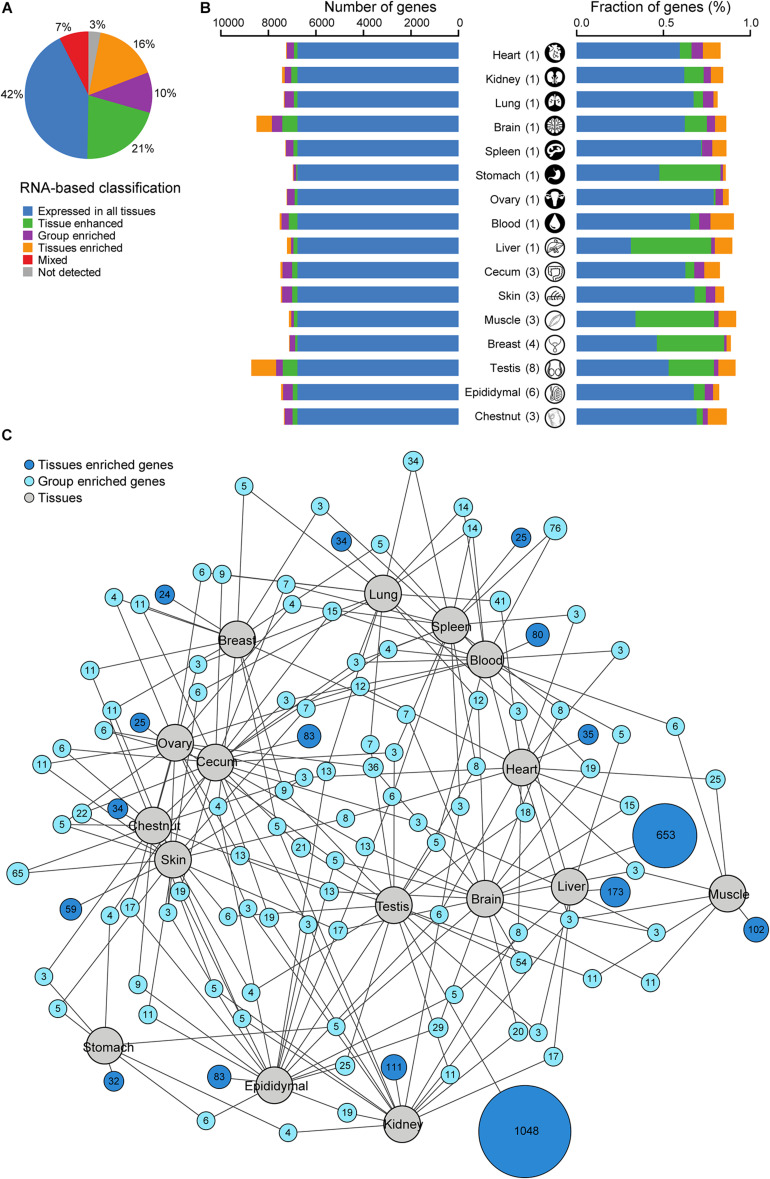
FIGURE 2.
Classification of all donkey protein-coding genes with regards to the transcriptional levels in 16 tissues. (A) Pie chart showing the distribution of all 16,013 genes into six different categories based on the transcript abundance (fragments per kilobase million, FPKM). (B) Number and fraction of genes detected on the mRNA level in each tissue. FPKM was used as a measure of gene expression. The colors are the same as in panel (A). (C) Network plot showing the relationship of tissue enriched and group enriched genes in various tissues and organs analyzed. Blue circle nodes represent a group of expressed genes and are connected to tissues represented by gray circles. Dark blue nodes show the number of group-enriched genes in up to five different tissue types (gray circles), with a minimum of three genes. Light blue nodes show the total number of tissue-enriched genes in each tissue. The size of each blue node represents the square root of the number of genes enriched in a particular combination of tissues. FPKM was used as a measure of gene expression.

