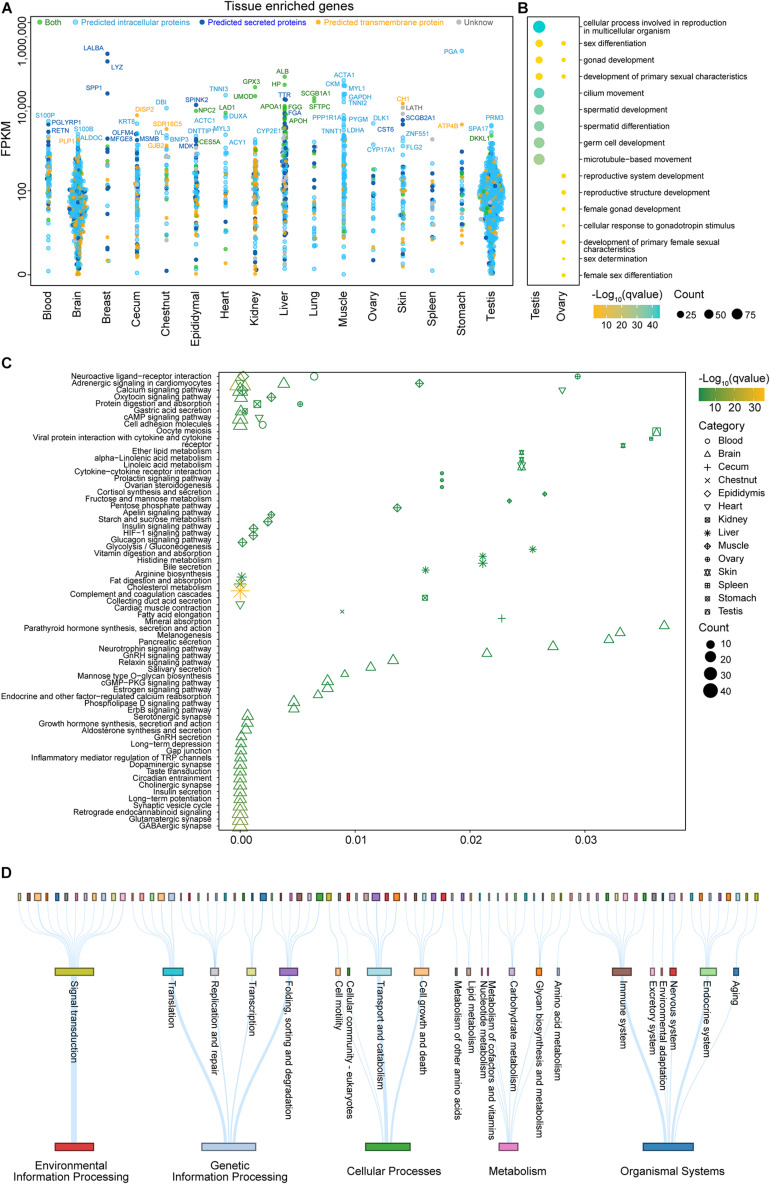
FIGURE 3.
Analysis of tissue-enriched genes in different organ systems and ubiquitously expressed genes. (A) The transcript levels (fragments per kilobase million, FPKM) on a log10 scale for all genes identified as tissue-enriched are shown for 16 tissues, with each gene stratified according to the predicted localization. (B) An analysis of significant Gene Ontology (GO) terms (biological process) for the testis and ovary based on the tissue-enriched genes which were categorized on the basis of FPKM (for more details on the GO analysis, see Supplementary Table 4). (C) A Kyoto Encyclopedia of Genes and Genomes (KEGG) pathway analysis for all tissues based on the tissue-enriched genes which were categorized on the basis of FPKM (see Supplementary Table 5 for more details). (D) A KEGG pathway analysis for ubiquitously expressed genes which were categorized on the basis of FPKM. Each row represents a different KEGG level. The thickness of the lines and the sizes of the squares are proportional to the number of genes in the corresponding pathway (see Supplementary Table 6 for more details).

