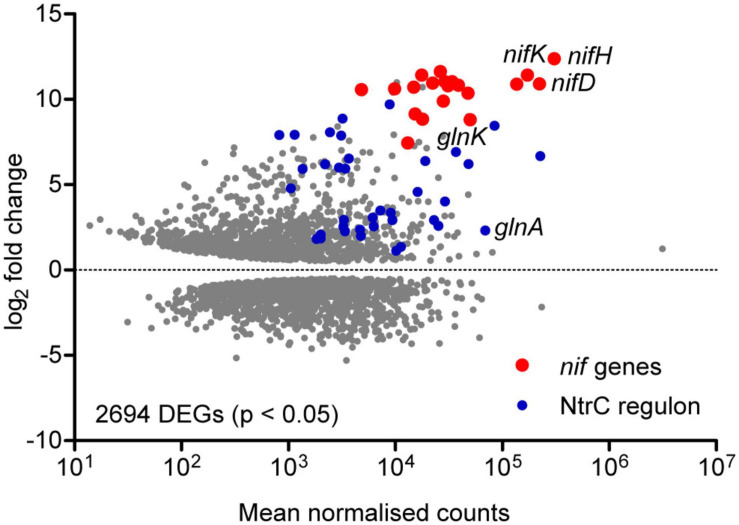
FIGURE 2.
Exploratory analysis of the diazotrophic transcriptome. MA plot of the log2 fold change and mean RNA-seq read count for all Ko M5a1 genes. Gray points represent differentially expressed genes (DEGs) in N-fixing conditions (0.5 mM NH4Cl run-out) with respect to N-replete (10 mM NH4Cl) conditions, with adjusted p-values of <0.05 as determined by DESeq2. Read counts were averaged (mean) across all N-fixing and N-replete samples and normalised using the regularised logarithm (rlog) transformation. DEGs belonging to the known nif and NtrC-dependent regulons are highlighted in red and blue, respectively.

