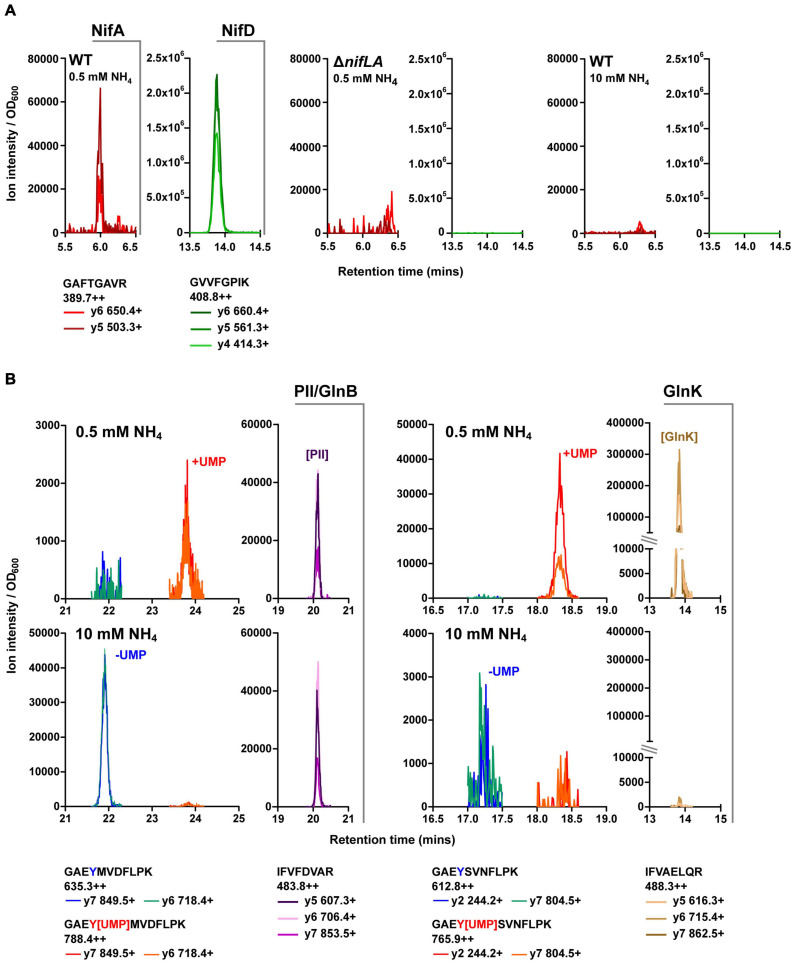
FIGURE 3.
Validation of key Nif and Ntr peptides. Retention time specific LC–MS peaks corresponding to candidate peptides (see Supplementary Data 1) in representative biological test samples: diazotrophic (wild-type, 0.5 mM NH4Cl), non-diazotrophic/N limiting (ΔnifLA, 0.5 mM NH4Cl) and N-replete (wild-type, 10 mM NH4Cl). Multiple daughter y-ion fragments (+) are shown for each parent ion (++), along with the corresponding m/z values. Peak ion intensity is normalised to sample OD600 for relative quantification between samples. (A) NifD and NifA. (B) GlnB and GlnK. Non-modifiable peptides are indicative of relative PII-protein abundance between samples. Peaks at discrete retention times represent uridylylated (+UMP; red/orange) and non-uridylylated (–UMP; blue/green) forms of modifiable peptides. Note variable y-axis scales.

