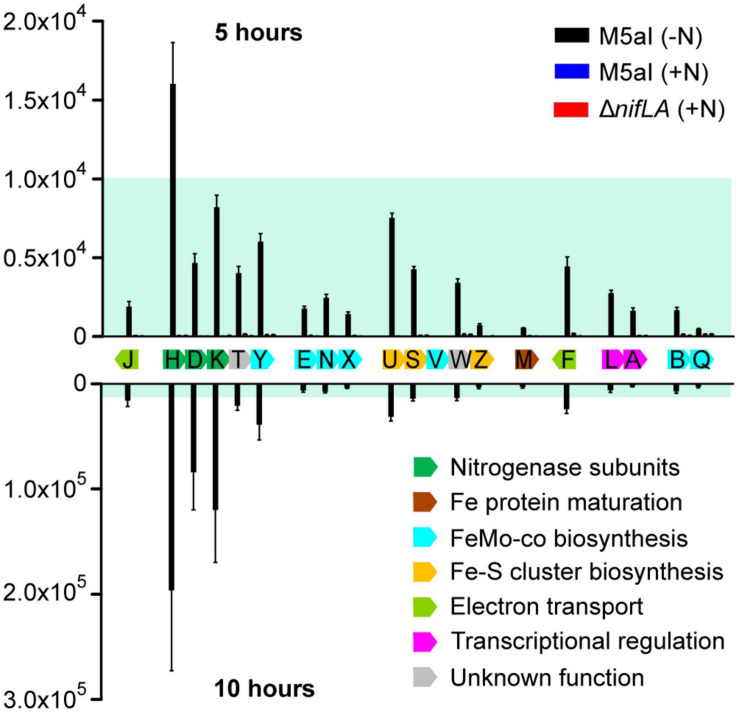
FIGURE 4.
Stoichiometry of Nif proteins during the onset of diazotrophy. Absolute copy number of 19 detectable Nif proteins at the onset of nitrogen starvation (5 h following supplementation with 0.5 mM NH4; above the x-axis) and at the onset of slow diazotrophic growth (10 h; below the x-axis) in Ko M5a1 wild-type cells (black bars). N-replete conditions (wild-type plus 10 mM NH4Cl; blue bars) and Nif– (ΔnifLA; red bars) cells were used as negative controls, which are barely visible in the figure. Protein samples were supplemented with heavy-labelled QconCAT standards (QNif1, QNif2, QNif3) prior to tryptic digestion. Multiple peptide transitions per Nif protein (see Supplementary Data 1) were integrated for calculation of absolute protein copy number per cell. Estimates inferred from known QconCAT concentrations and the mean sample/QconCAT LC–MS peak area ratio, assuming an OD600 of 1.0 = 109 CFU mL–1 and a cell volume of 10–15 L. Error bars represent SEM of three biological replicates. NifV was undetectable in all samples. Nif proteins are displayed according to genomic organization and colored by function. Blue shading representative of ≤10,000 copies and highlights variable y-axis scale.

