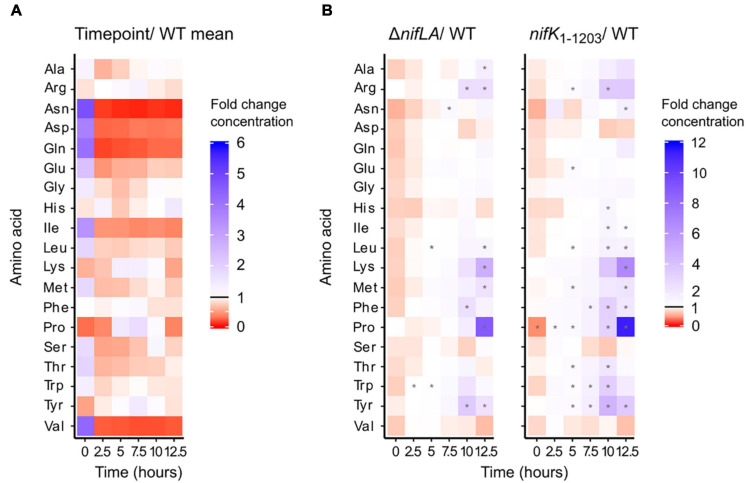
FIGURE 6.
Dynamics of the intracellular amino acid pools during the diazotrophy transition. Ko M5a1 wild-type, nifK1–1203, and ΔnifLA strains were cultured for 12.5 h in NFDM medium supplemented with 0.5 mM NH4Cl. Polar metabolites were extracted at 2.5 h intervals, derivatised with the AccQTag reagent (6-aminoquinolyl-N-hydroxysuccinimidyl carbamate) and analyzed via LC–MS. Absolute amino acid concentrations were calculated by referencing external standard curves, assuming a characteristic cell volume of 10–15 L. (A) Time course of wild-type amino acid pools. Heat map density representative of fold-change between time-specific concentrations and the base mean amino acid concentration across all time points. Asterisks denote statistically significant differences from base mean (one sample unpaired Student’s t-test, N = 3, p < 0.05). (B) Time course of ΔnifLA and nifK1–1203 amino acid pools. Heat map density representative of fold-change between ΔnifLA and nifK1–1203 amino acid concentrations and wild-type. Asterisks denote statistically significant differences between mutant and wild-type means (two sample unpaired Student’s t-test, N = 3, adjusted p-value (False Discovery Rate; Benjamini and Hochberg, 1995; p < 0.05). Note different heat map density scales between panels (A,B). Absolute amino acid concentrations are detailed in Supplementary Data 3.

