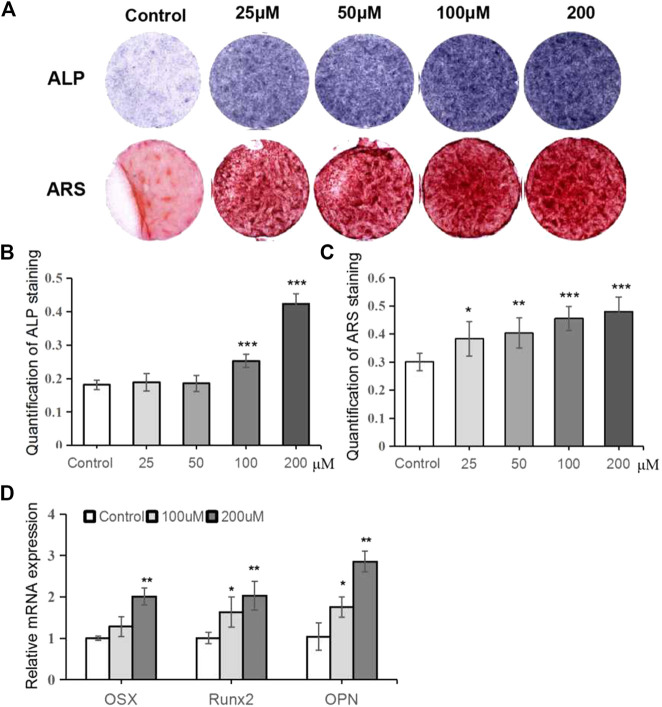
FIGURE 2.
TRX promoted osteoblast differentiation of MSCs. (A) Qualitative examiation of ALP staining and ARS staining. (B) The quantitative assay of ALP activity. (C) The quantitative assay of ARS staining. (D) The quantitative assay of OD value. (E) The expression of several osteogenic marker genes was measured by qRT-PCR assays at day 14. *, p < 0.05; **, p < 0.01; ***, p < 0.001; vs. Control.

