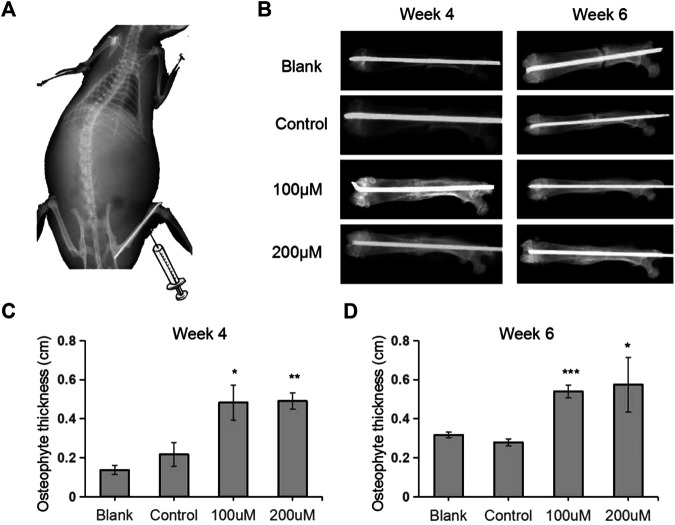
FIGURE 4.
Quantitative analyses of osteophyte thickness by X-ray radiography. (A) The diagram of the femoral fracture model in rat. (B) X-ray images were taken during the fracture healing processes at week 4 and week 6. (C–D) The osteophyte thickness of the newly formed bone was analyzed at week 4 (C) and week 6 (D). n = 6; *, p < 0.05; vs. Control.

