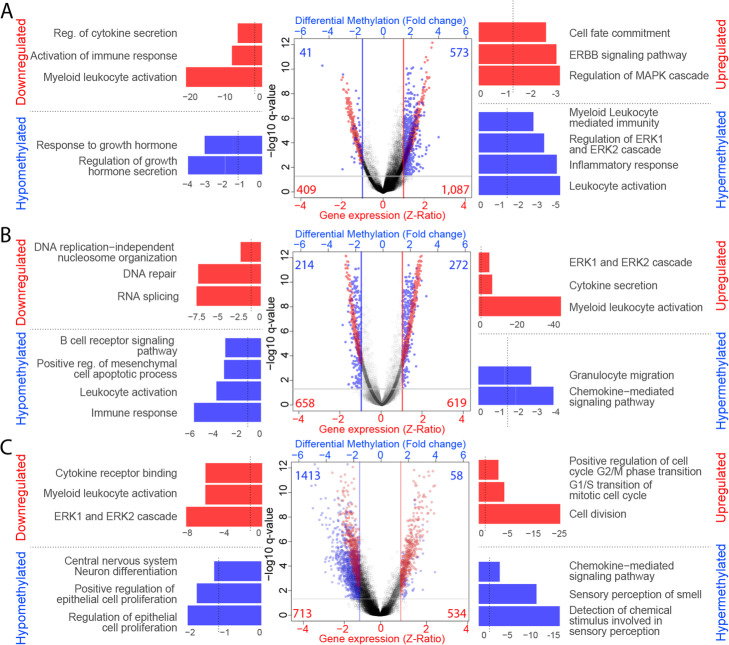
Fig. 5.
Analysis of differentially expressed genes and differentially methylated sites in GBM Subtypes. Left panel: Gene Enrichment Analysis of downregulated genes (red bars) and hypomethylated CpG sites (blue bars) in each subtype. Vertical lines represent the p-value cutoff (p = 0.05). Middle panel: Volcano Plot, representing differential gene expression (Z-Ratio; red dots) and differentially methylated CpG sites (M-value fold change; blue dots). Horizontal lines indicate the q-value threshold (Student’s t-test, corrected by FDR = 0.05). Right panel: Gene Enrichment Analysis of upregulated genes (red bars) and hypermethylated CpG sites (blue bars) in each subtype, being (A) Classical subtype, B Mesenchymal subtype, and C Proneural subtype. Vertical lines represent the p-value cutoff (p = 0.05)

