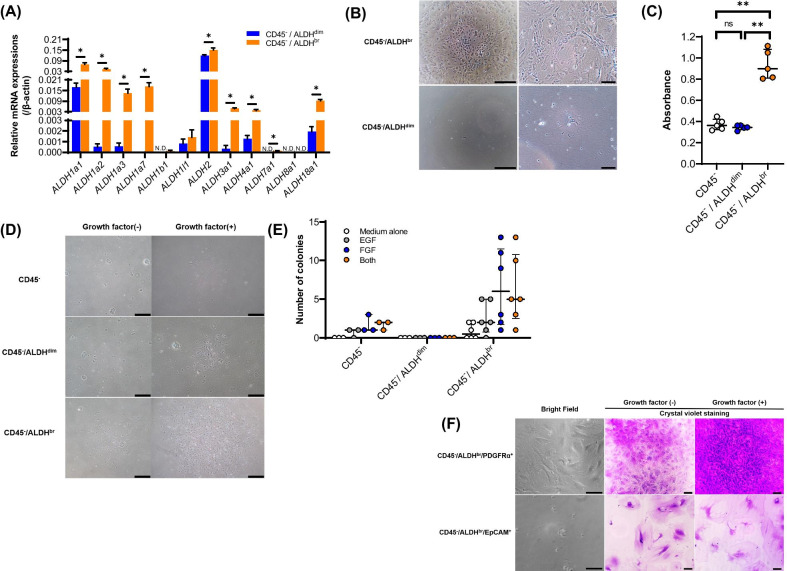
Fig. 2.
A Real-time quantitative PCR analysis of the mRNA expression levels of ALDH isoforms in sorted CD45−/ALDHbr (n = 3) and CD45−/ALDHdim cells (cell population with low ALDH activity, n = 3). Values are expressed relative to the expression of the endogenous control β-actin mRNA. Data are shown as mean ± SEM. *P < 0.05, N.D., not detectable. B Representative image of cultured cells (left, low-power field, scale bar, 400 µm, right, high-power field, scale bar, 100 µm). C The proliferative capacity of cells using a CCK-8 kit (n = 5/group), as shown in (B). **P < 0.01. D Representative image of colonies derived from the colony-forming assay using MethoCult supplemented with or without growth factors. Scale bar, 400 µm. E The number of colonies derived from the colony-forming assay in (D). F Representative image of sorted cell populations cultured with or without growth factors. The bright field and cells stained with crystal violet are shown. Scale bar, 70 µm. G Sorted CD45−/ALDHbr/PDGFRα+ cells induced for differentiation into adipocytes and stained with Oil red O. Scale bar, 70 µm

