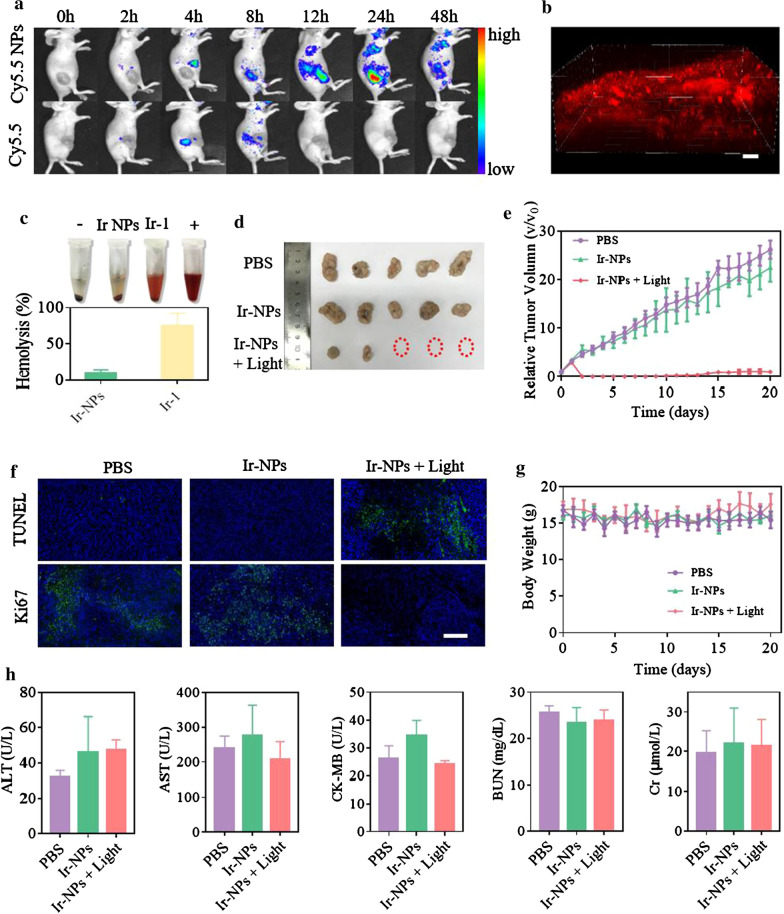
Fig. 4.
In vivo imaging and therapeutic efficacy of Ir-NPs. In vivo fluorescence biodistribution (a) of Cy5.5 NPs and free Cy5.5 in Skov3 tumor-bearing mice. 3D fluorescence imaging (b) of tumor tissue under two-photon excitation, λex = 810 nm, λem = 590 ± 20 nm, scale bar: 100 μm. Hemolytic activity of Ir-1 and Ir-NPs (n = 3) (c). Image of the Skov3 tumors (d) isolated from mice after treatments of PBS, Ir-NPs (0.15 mg/kg) and Ir-NPs + Light (0.15 mg/kg). Tumor growth curves (e) and body weight (f) of Skov3 tumor-bearing mice during the therapeutic period (n = 5). g TUNEL assay and Ki67 immunofluorescence analysis of tumor sections after treatments, scale bar = 200 μm. h In vivo biological safety assessed by serum biochemical analysis after the treatment course (n = 3)

