Fig. 2.
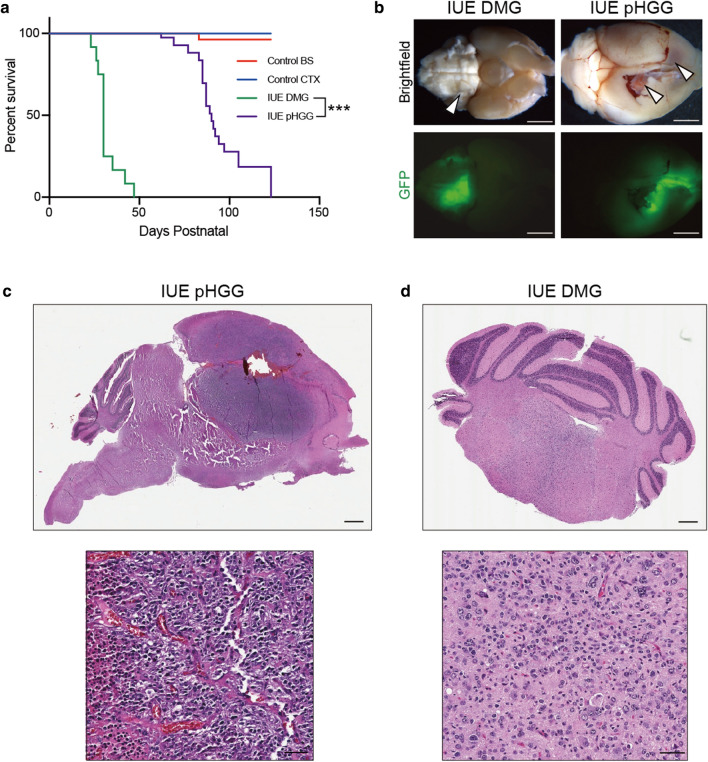
Generation of IUE pHGG and DMG mouse models. a Kaplan–Meier survival curves for IUE conditions: control brainstem (H3.3WT + DNp53, n = 11), control cortex (H3.3WT + DNp53, n = 12), IUE DMG (PdgfraD842V + DNp53 + H3.3K27M, n = 12) and IUE pHGG (PdgfraD842V + DNp53 + H3.3G34R, n = 19). ***p < 0.0001, Log-rank Mantel-Cox test. b Representative whole brain brightfield and GFP images depicting the regional location of IUE DMG and pHGG mouse models. Arrowheads point towards GFP-positive tumor regions. Scale bar = 1 mm. c H&E staining of IUE pHGG and IUE DMG sections. d High magnification inset images of H&E stained sections. Scale bars = 500 µm (top panels) and 50 µm (bottom panels)

