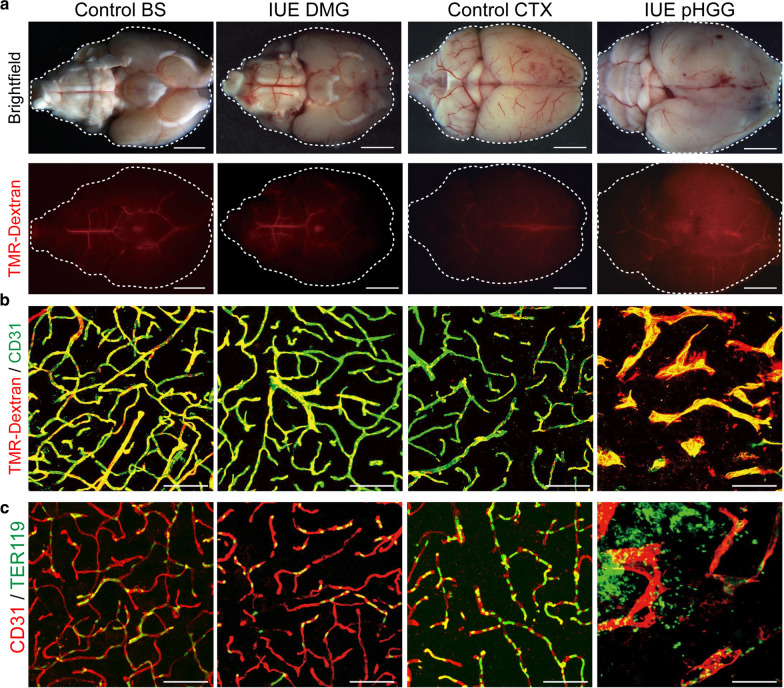
Fig. 4.
pHGG and DMG mouse models display differences in BBB function. a Representative whole brain images of brightfield and fluorescent TMR-dextran signal in control and IUE tumor conditions. Scale bar = 1 mm. b Representative immunofluorescent z-stack projection images of TMR-dextran and CD31 labeled sections. Scale bar = 20 μm. c Representative immunofluorescent z-stack projection images of control and IUE tumor conditions labeled with CD31 and Ter119 depicting the retention or extravascular leakage of red blood cells within samples. Scale bar = 20 μm

