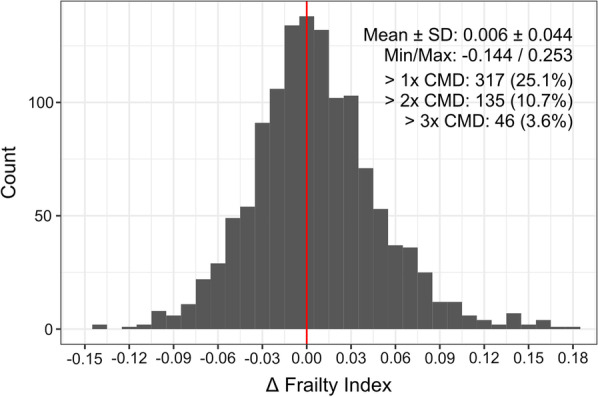
Fig. 1.

Summary of the change in frailty from baseline to 3-year follow-up. The change in frailty was calculated as the follow-up value minus the baseline value for all participants who provided follow-up data (n = 1264). The mean and standard deviation, and minimum and maximum change are shown, along with the number and frequency of participants that exhibited greater than one, two or three times the clinically meaningful difference (CMD) in frailty (i.e., 0.03; also shown as vertical blue lines). The vertical red line shows no difference
