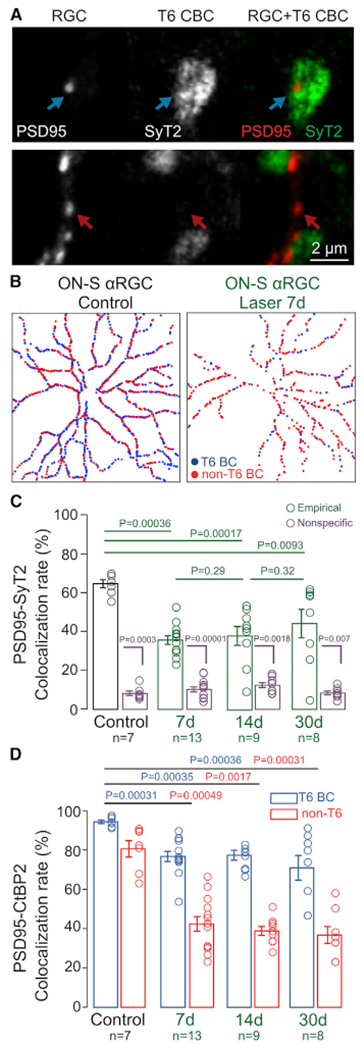
Figure 2. Biased disconnection of AON-S RGCs from presynaptic BC types.

(A) Top row: example of a postsynaptic excitatory site (PSD95-YFP) apposed to a presynaptic axon from T6 BCs (labeled by SyT2, top row) or to unlabeled (not T6) BC axon (bottom row). Scale bar: 2 μm.
(B) Example connectivity maps between postsynaptic PSD95 and presynaptic T6 BCs in AON-S RGC from control (left panel) and LIOH (right panel) retinas.
(C) Colocalization rates between PSD95 and T6 BCs in control retinas and 7, 14, and 30 days after IOP elevation (green), compared to nonspecific colocalization obtained by 90 degree rotation of the T6 BC channel (purple).
(D) Rate of PSD95-CtBP2 colocalization for synapses apposed to T6 BCs (blue) and non-T6 BCs (red).
Bar plots: mean ± SEM. Circles: individual values. p values: rank-sum comparisons. n = number of AON-S RGCs, from N = 7 animals per group.
