
Figure 3. AON-S RGCs rewire with developmental partners, RBCs, but not because of increased RBC volume or ribbon density.
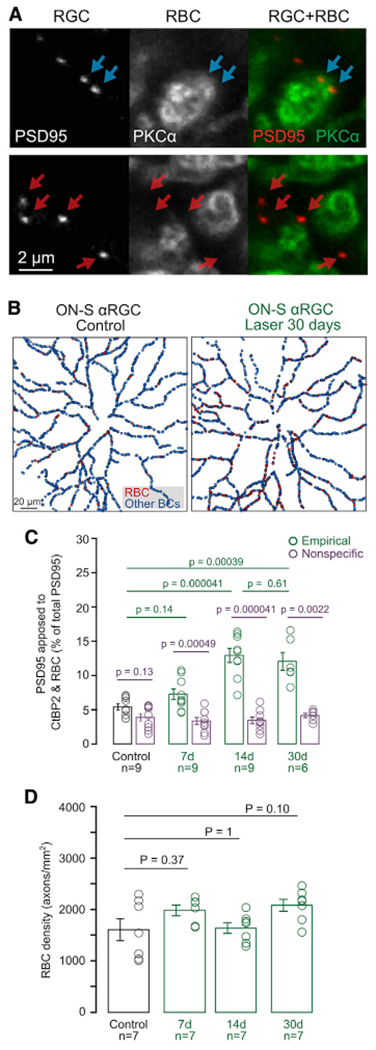
(A) Example of postsynaptic excitatory sites (PSD95-YFP) apposed to RBC axon terminals (top row) or to unlabeled (not-RBC) BCs (bottom row). Scale bar: 2 μm.
(B) Example connectivity maps between postsynaptic PSD95 and presynaptic RBCs in AON-S RGC from control (left panel) and LIOH (right panel) retinas.
(C) Fraction of PSD95 colocalized with RBCs in experimental data (green), compared to nonspecific colocalization level obtained by 90 degree rotation of the RBC channel (purple). Bar plots: mean ± SEM. Circles: individual RGC values. Rank-sum comparisons between groups indicated by lines. n = number of AON-S RGCs analyzed, from N = 7 animals per group.
(D) RBC density measured by count of PKC-labeled axon stalks. n = number of retinas, from N = 7 animals per group.