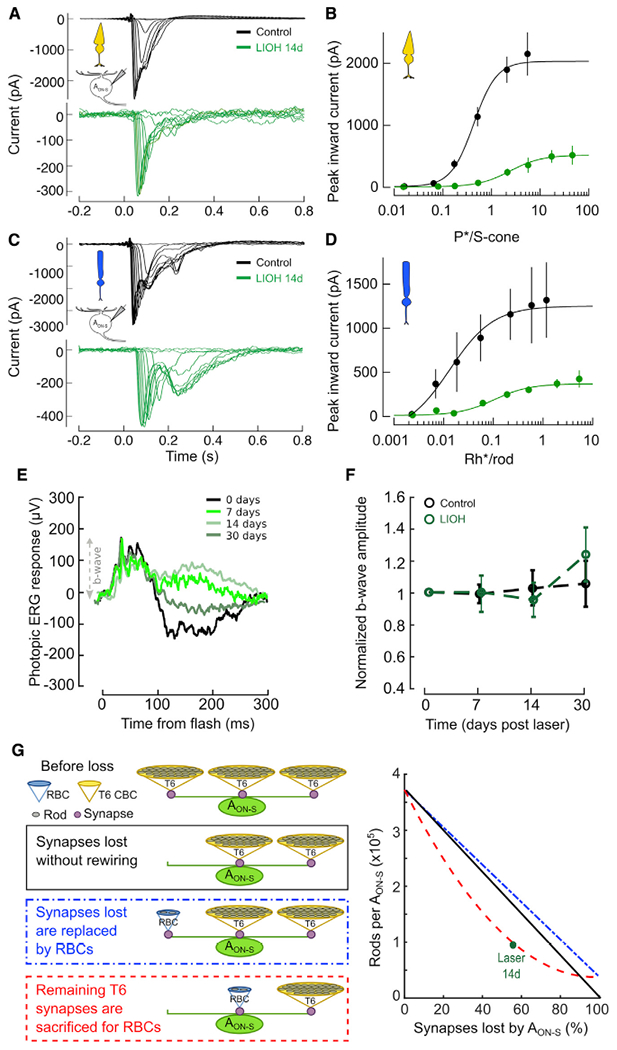
Figure 4. Light response of AON-S RGCs, but not of presynaptic BCs, is impaired.

(A and B) Cone-driven light responses in AON-S RGCs in response to 10 ms UV flashes of increasing light intensities on top of a blue rod-saturating background. Left panel: individual responses from representative RGCs. Right panel: peak inward current (mean ± SEM) as a function of isomerizations per s cone (P*/s-cone). solid lines: best-fit Hill equation (see STAR Methods). Excitatory currents were isolated by voltage clamping at −60 mV. n = recorded cells (7 control, 14 LIOH), from N = 10 animals. See also Table S2.
(C and D) Rod-driven light responses in AON-S RGCs in response to 10 ms blue flashes of increasing light intensities in darkness. Left panel: individual responses from representative RGCs. Right panel: inward peak inward current (mean ± SEM) as a function of isomerizations per rod (Rh*/ rod). Solid lines: best-fit Hill equation (see STAR Methods). Excitatory currents were isolated by voltage clamping at −60 mV. n = recorded cells (7 control, 14 LIOH), from N = 10 animals. See also Table S2.
(E) Left panel: example longitudinal traces of photopic ERG at different time points from LIOH. N = 6 animals per group.
(F) Photopic b-wave amplitude relative to baseline as a function of time from LIOH. N = 6 animals.
(G) Rod convergence onto AON-S RGCs via T6 CBCs and direct connectivity with RBCs as a function of BC-RGC synapse loss estimated in three case scenarios: after synapse loss without rewiring (black line); after synapses lost with T6 CBCs replaced by RBCs (blue line); after RBCs are rewired at the expense of remaining T6 BCs (red line). Green circle: estimated rod convergence from observed connectivity data.
