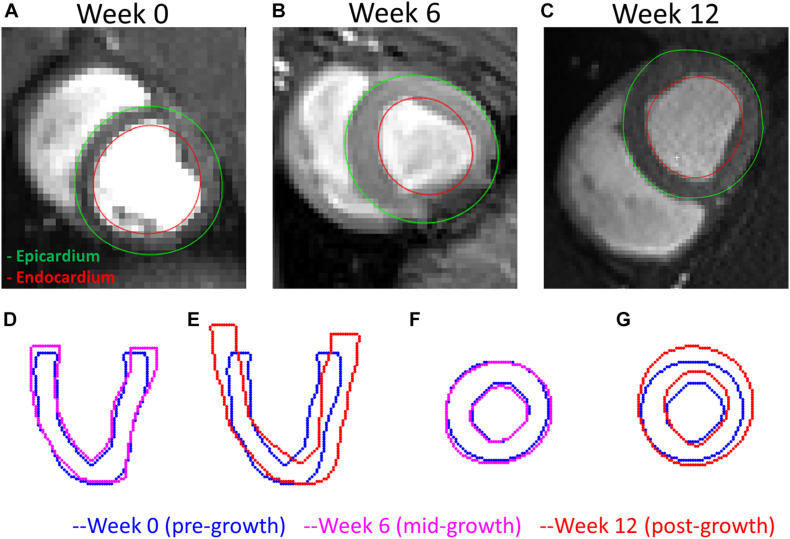
FIGURE 7.
A comparison of the LV geometries before and after exercise-induced growth. (A–C) MRI short-axis views of the LVs at weeks 0, 6, and 12 during exercise training. (D,E) Long-axis views comparing weeks 0–6 and 12 LV geometries. (F,G) Short-axis views comparing weeks 0–12 LV geometries. Rigid registrations were performed between the two geometries in panels (D–G).

