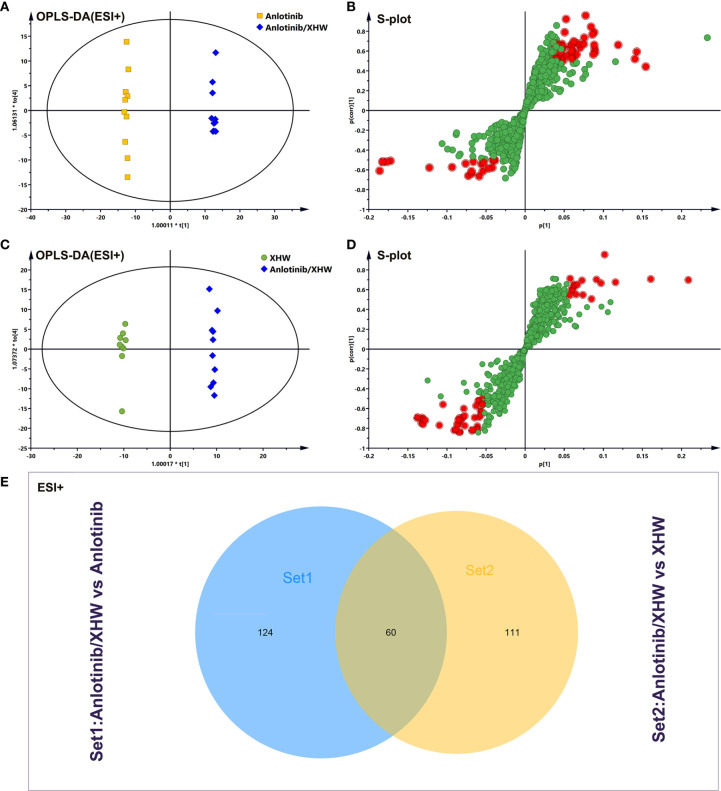
Figure 4.
Analysis of potential biomarkers associated with anlotinib plus XHW in the treatment of lung cancer in ESI+ mode. (A) Results of the OPLS-DA model using the data from the anlotinib/XHW group vs the anlotinib group. (B) S-score plot constructed from the supervised OPLS analysis of the anlotinib/XHW group vs the anlotinib group. (C) Results of the OPLS-DA model using the data from the anlotinib/XHW group vs the XHW group. (D) S-score plot constructed from the supervised OPLS analysis of the anlotinib/XHW group vs the XHW group. Metabolite ions with variable influence on the projection (VIP) values >1 and |p(corr)| ≥ 0.5 are marked with a red square. The x-axis represents the co-correlation coefficient between the principal component and the metabolite, and the y-axis represents the correlation coefficient between the principal component and the metabolite. (E) Venn diagram of metabolites showing the overlap between the anlotinib/XHW, anlotinib, and XHW groups.

