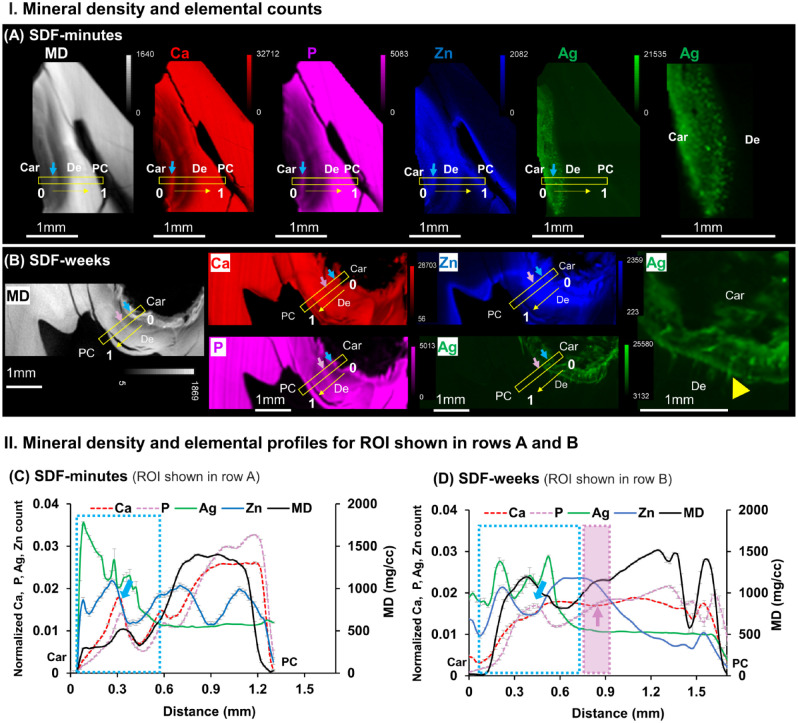
Figure 2.
Varied distributions of elemental Ca, P, Zn, and Ag “shaped” the mineral density (MD) profiles unique to carious lesions treated with SDF-minutes and SDF-weeks. MD (white) from micro X-ray computed tomography and X-ray fluorescence microprobe elemental maps of Ca (red), P (pink), Zn (blue), and Ag (green) in carious primary teeth treated with a onetime SDF application and extracted (A) 2 min after application (SDF-minutes, tooth 4) and (B) 3 wk after application (SDF-weeks, tooth 9). Right-most panel shows Ag distribution at a higher magnification for both treatment groups and indicates Ag distribution along the length of the dentinal tubules in the SDF-weeks group (yellow arrowhead). MD and elemental profiles for regions of interest (ROIs; yellow boxes) from the carious margin (0) to the pulp chamber (1) in panels A and B are shown for teeth treated with SDF for (C) minutes (tooth 4) and (D) weeks (tooth 9). SDF penetration depth (light blue dotted rectangle) was estimated by spatially correlating the MD profile with that of the Ag and Ca elemental profiles. The penetration depths of SDF-minutes and SDF-weeks were ~0.5 ± 0.02 mm and ~0.6 ± 0.05 mm (mean ± SD), (yellow arrows, direction; white arrows, location of Ag particles) respectively. Ca and P peaks (light blue arrows) within carious lesions indicated potentially remineralized areas. Increased P counts with decreased Ca counts (light purple arrow within purple rectangle) were observed. Car, caries; De, dentin; PC, pulp chamber; SDF, silver diamine fluoride.

