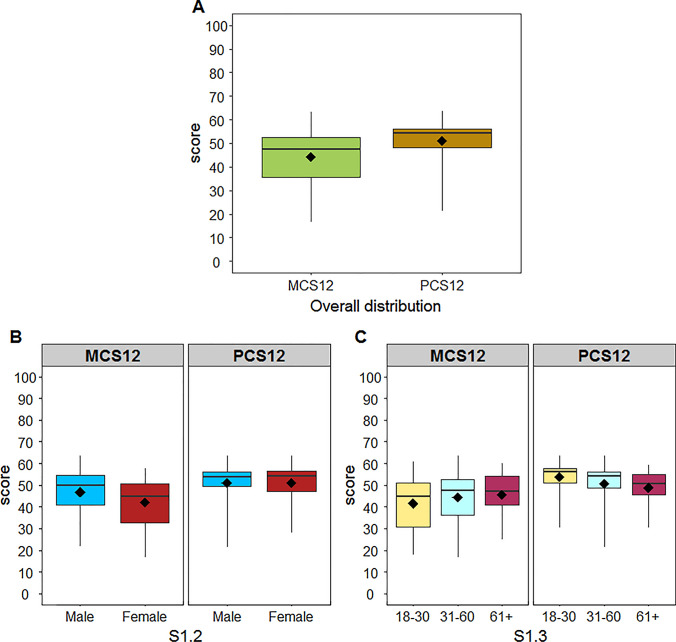
Fig. 1.
Distribution of the two component summary scores (MCS12 and PCS12). The box plots report the overall distribution of the two component summary scores (A) and the distribution of the two component summary scores according to sex (B) and age class (C). Each box indicates the 25th and 75th centiles. The horizontal line inside the box indicates the median, the black dot represents the mean, and the whiskers indicate the range measured

