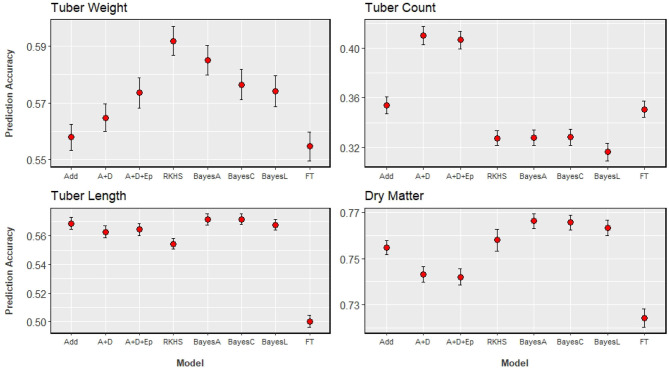
Figure 4.
GP results of the four analysed traits, with prediction accuracy on the y-axis, and the x-axis indicating the model used: Add (GBLUP with additive genomic relationship matrix), A+D (GBLUP with additive and dominance relationship matrices), A+D+Ep (GBLUP with additive, dominance, and epistatic relationship matrices), RKHS (Reproducing Kernel-Hilbert Space model), BayesC (Bayes Cπ model), BayesL (Bayesian LASSO model), FT (Full Tetraploid as proposed by Slater et al., 2016). Standard errors of estimates are illustrated with the bars around the points.

