FIGURE 2.
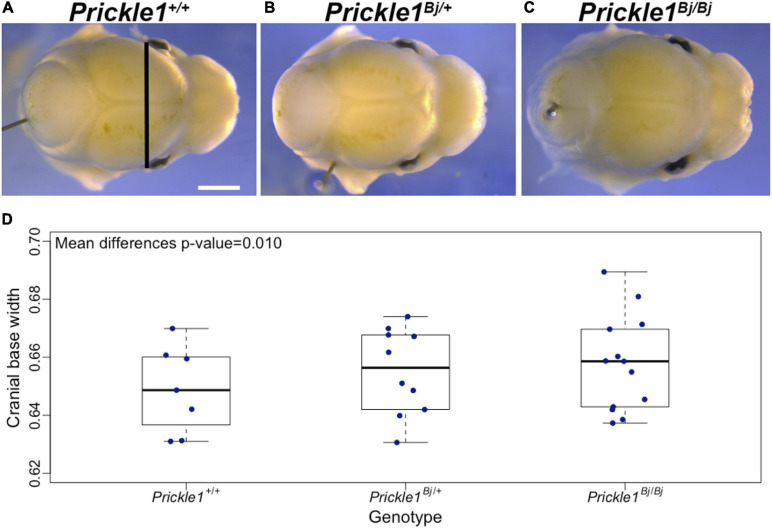
The Prickle1Bj mouse allele dosage was associated with a wider cranial base. (A–C) Superior views of littermates at embryonic day 14.5 showing craniofacial shape changes in Prickle1Bj/Bj compared to Prickle1+/+. Cranial base width measurement is indicated by the black line in (A). Scale bar, 1 mm (and applies to A–C). (D) Box plot of the cranial base width. Thick horizontal lines represent group medians. The p-value was obtained from the test of group mean differences assuming an additive genetic model, adjusting for head size and litter.

