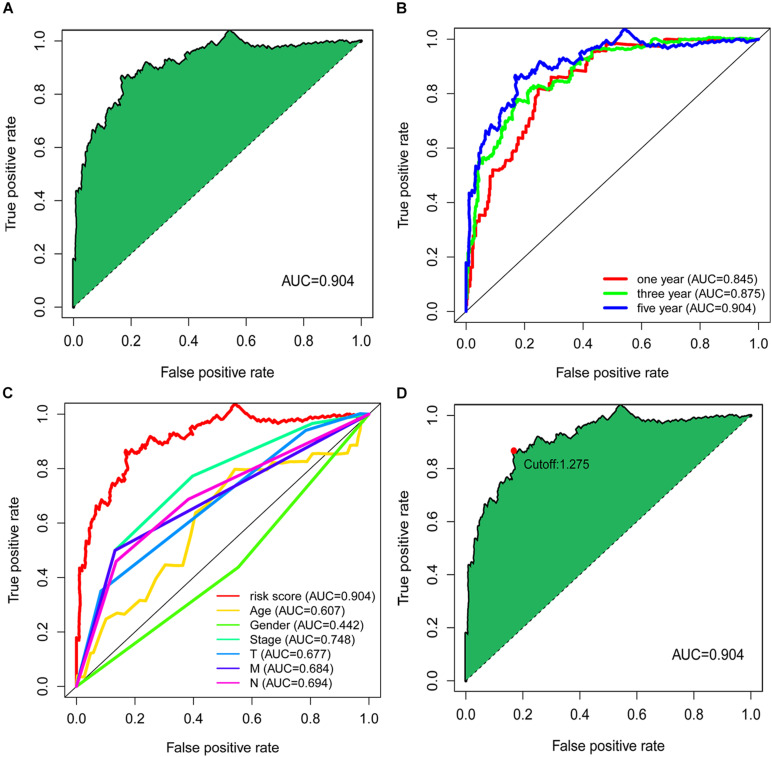
FIGURE 2.
Establishment of the signature based on DEirlncRNA pairs. (A) The 5-year ROC of the optimal signature. (B) The AUC values of the 1-year, 3-year, and 5-year ROC curves of the model. (C) The comparation of 5-year ROC curve with other clinical characteristics. (D) The risk score of 1.275 at the maximum end was taken as the cut-off value to distinguish the high and low risk of samples.

