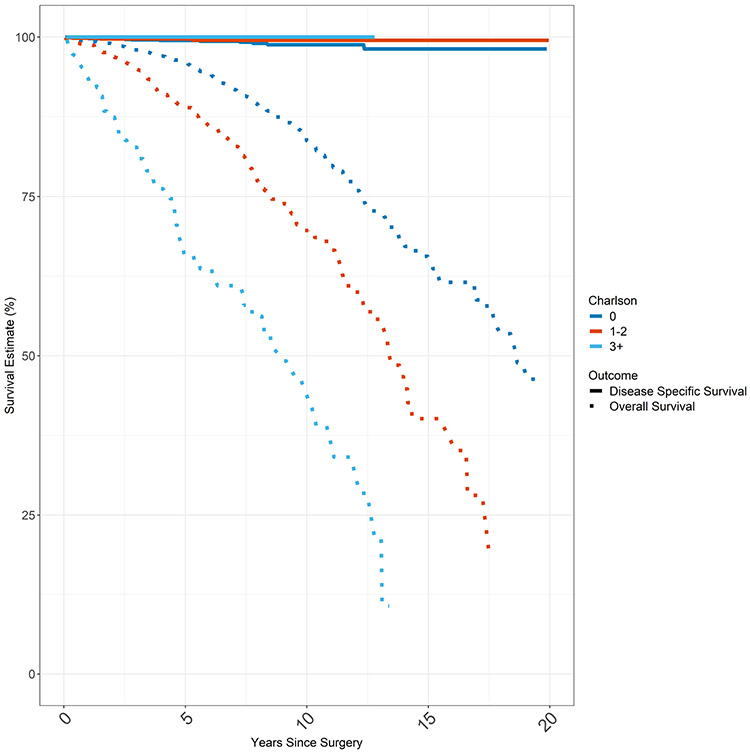
Figure 2.
Overall Survival & Disease Specific Survival
Total cancer cohort consisting of first and only cancer (T1, N0, M0 PTC; n = 3280). Overall survival and disease specific survival of total cohort by Charlson Comorbidity Score. Disease specific survival approximates 100% whereas overall survival worsens with increasing Charlson Comorbidity Index Score. DSS is represented by the solid lines and OS is represented by the dashed lines. Each CCS category (0, 1-2, 3+) is represented by a different color.

