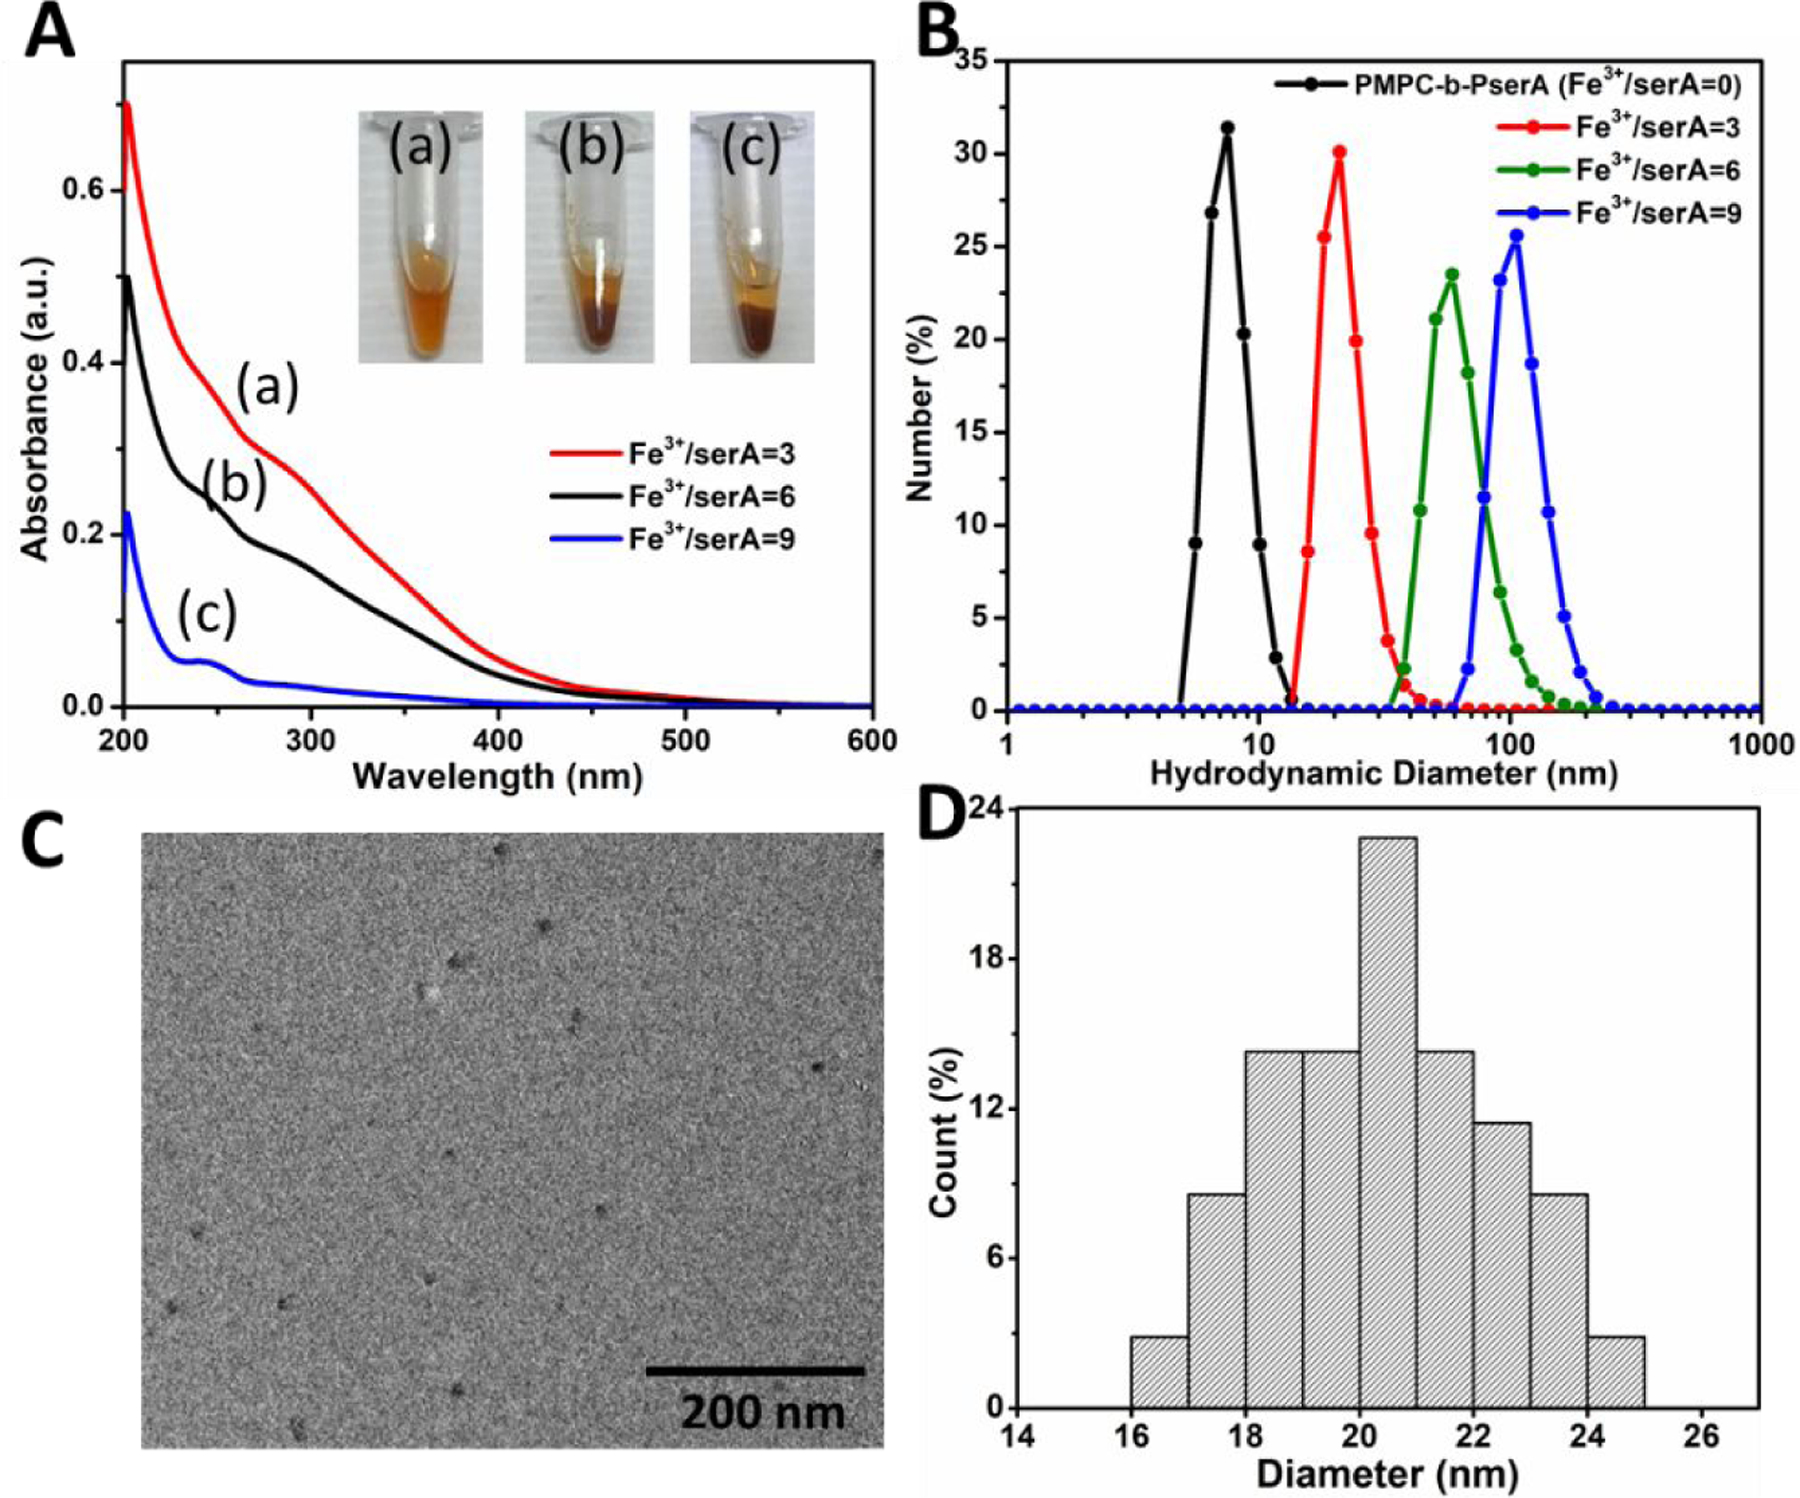
Figure 2. Characterization of NCP nanoparticle formation and size.

(A) UV-vis spectra of NCP nanoparticles at Fe3+ to serA molar ratios of 3 (a), 6 (b), and 9 (c). Inset: photographs of corresponding colloid solutions. (B) DLS analysis of the polymer and NCP nanoparticles showed that the average hydrodynamic diameter varied from 9.7±1.5 to 111.4±28.3 nm when the Fe3+/serA was increased from 0 to 9. (C) TEM image of NCP nanoparticles (Fe3+/serA = 3), showing a spherical particle morphology. (D) Size distribution of NCP nanoparticles (Fe3+/serA = 3); the particle diameter varied from 16 to 25 nm (average diameter, 20.5±1.9 nm).
