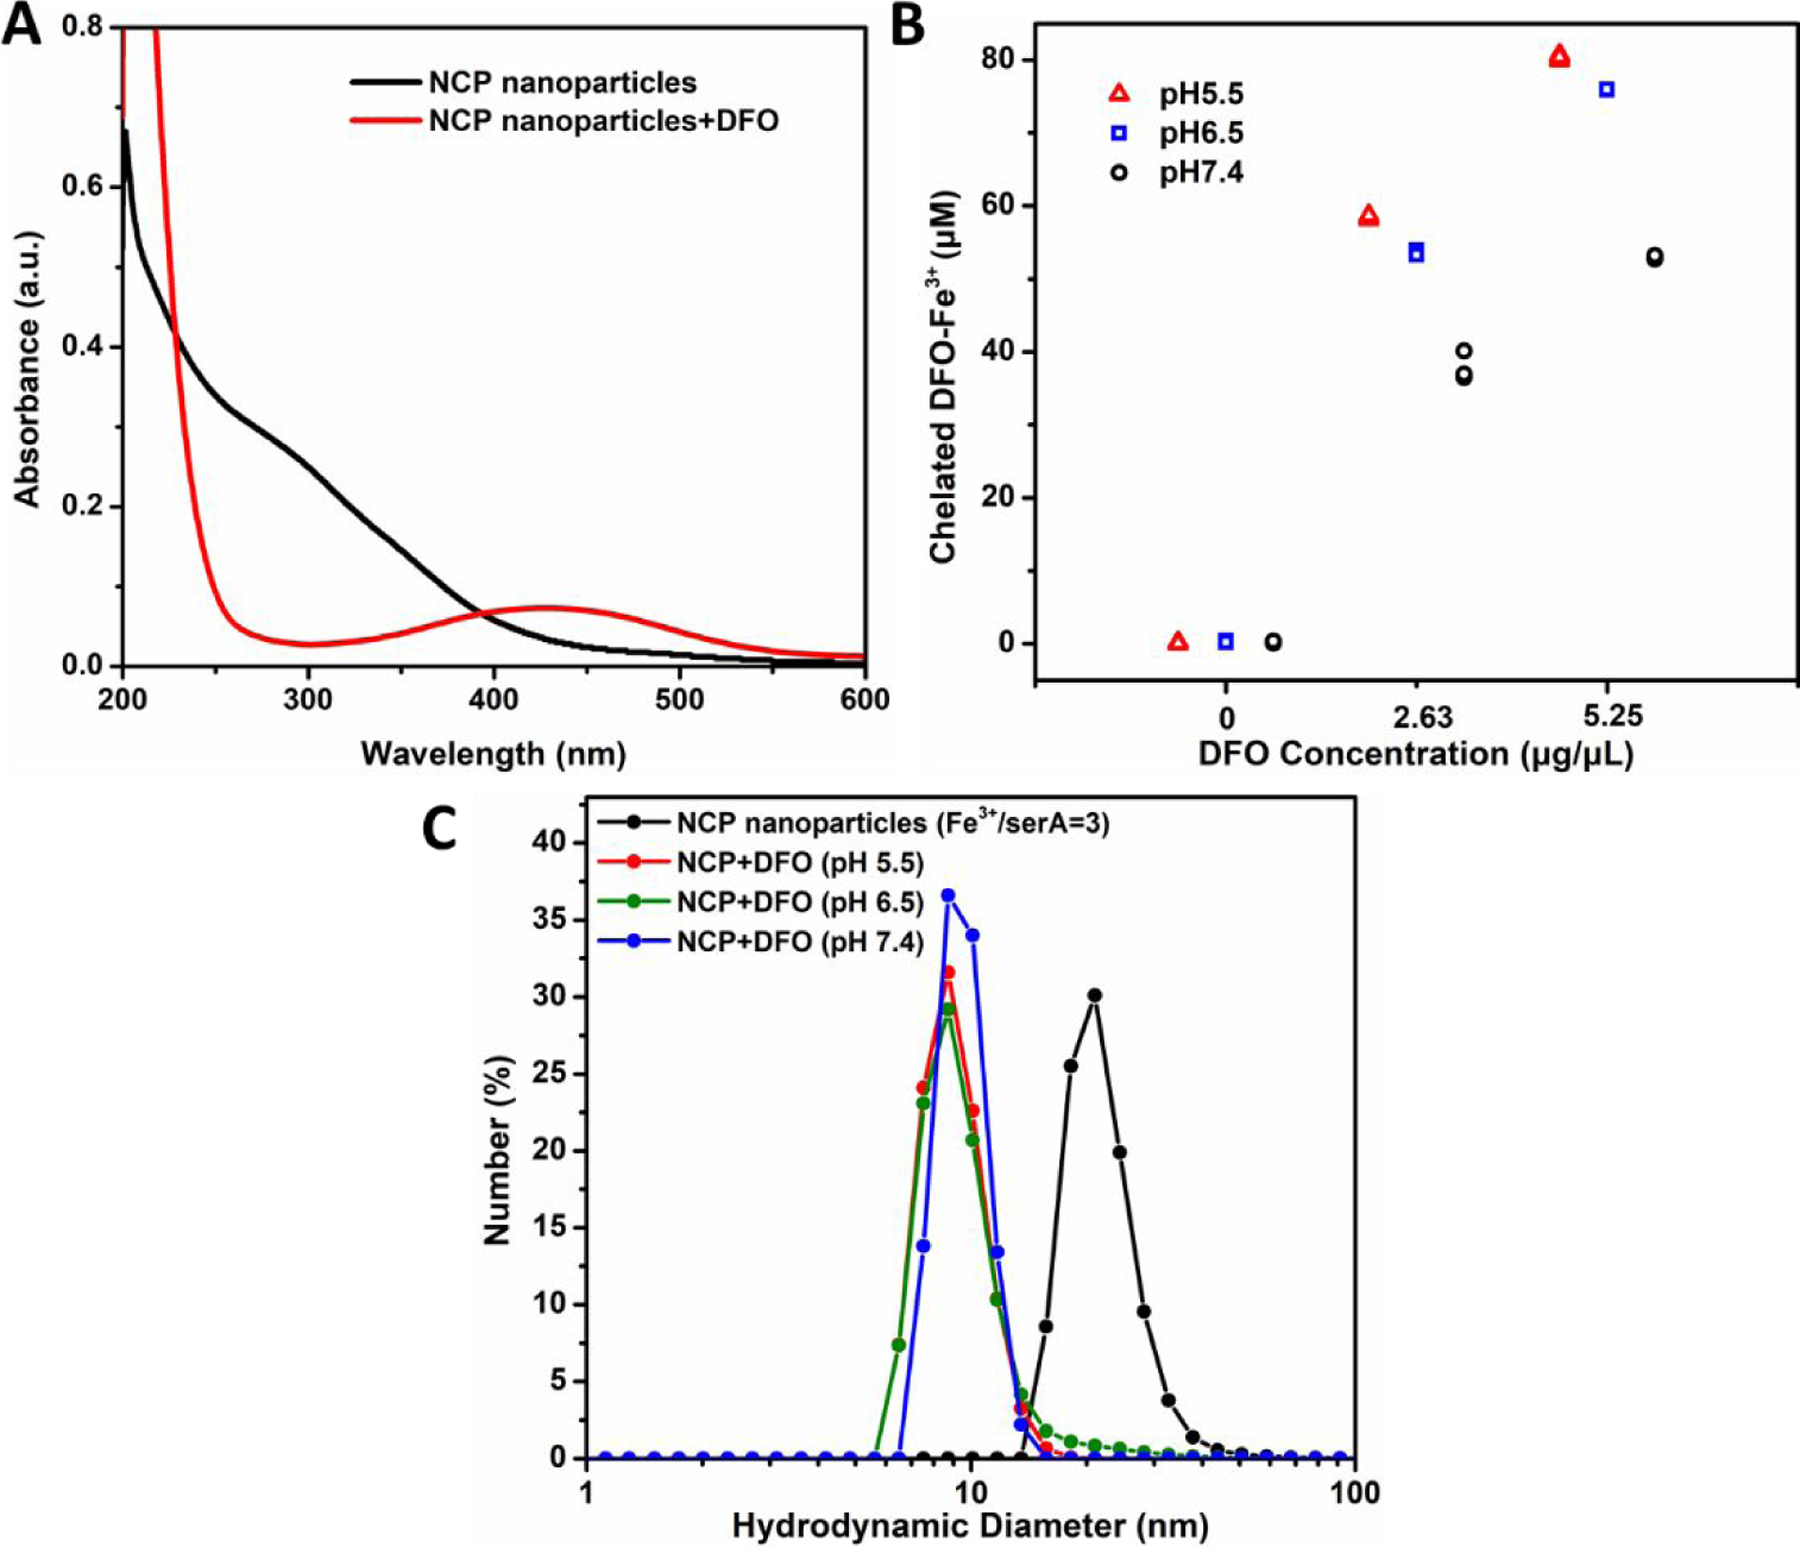
Figure 3. Characterization of NCP nanoparticles with and without DFO.

(A) UV-vis spectra of NCP nanoparticles (Fe3+/serA=3) with DFO (red) and without DFO (black). After DFO addition, the broad absorption of NCP nanoparticles between 200 and 450 nm diminished, and a peak at 430 nm appeared. (B) Concentrations of DFO-Fe3+ complexes for NCP nanoparticles treated with different amount of DFO at different solution pH values. (C) DLS analysis of the NCP nanoparticles (Fe3+/serA = 3) with and without DFO (2.6 µg/µL) at pH 5.5, 6.5, and 7.4.
