
Figure 1.
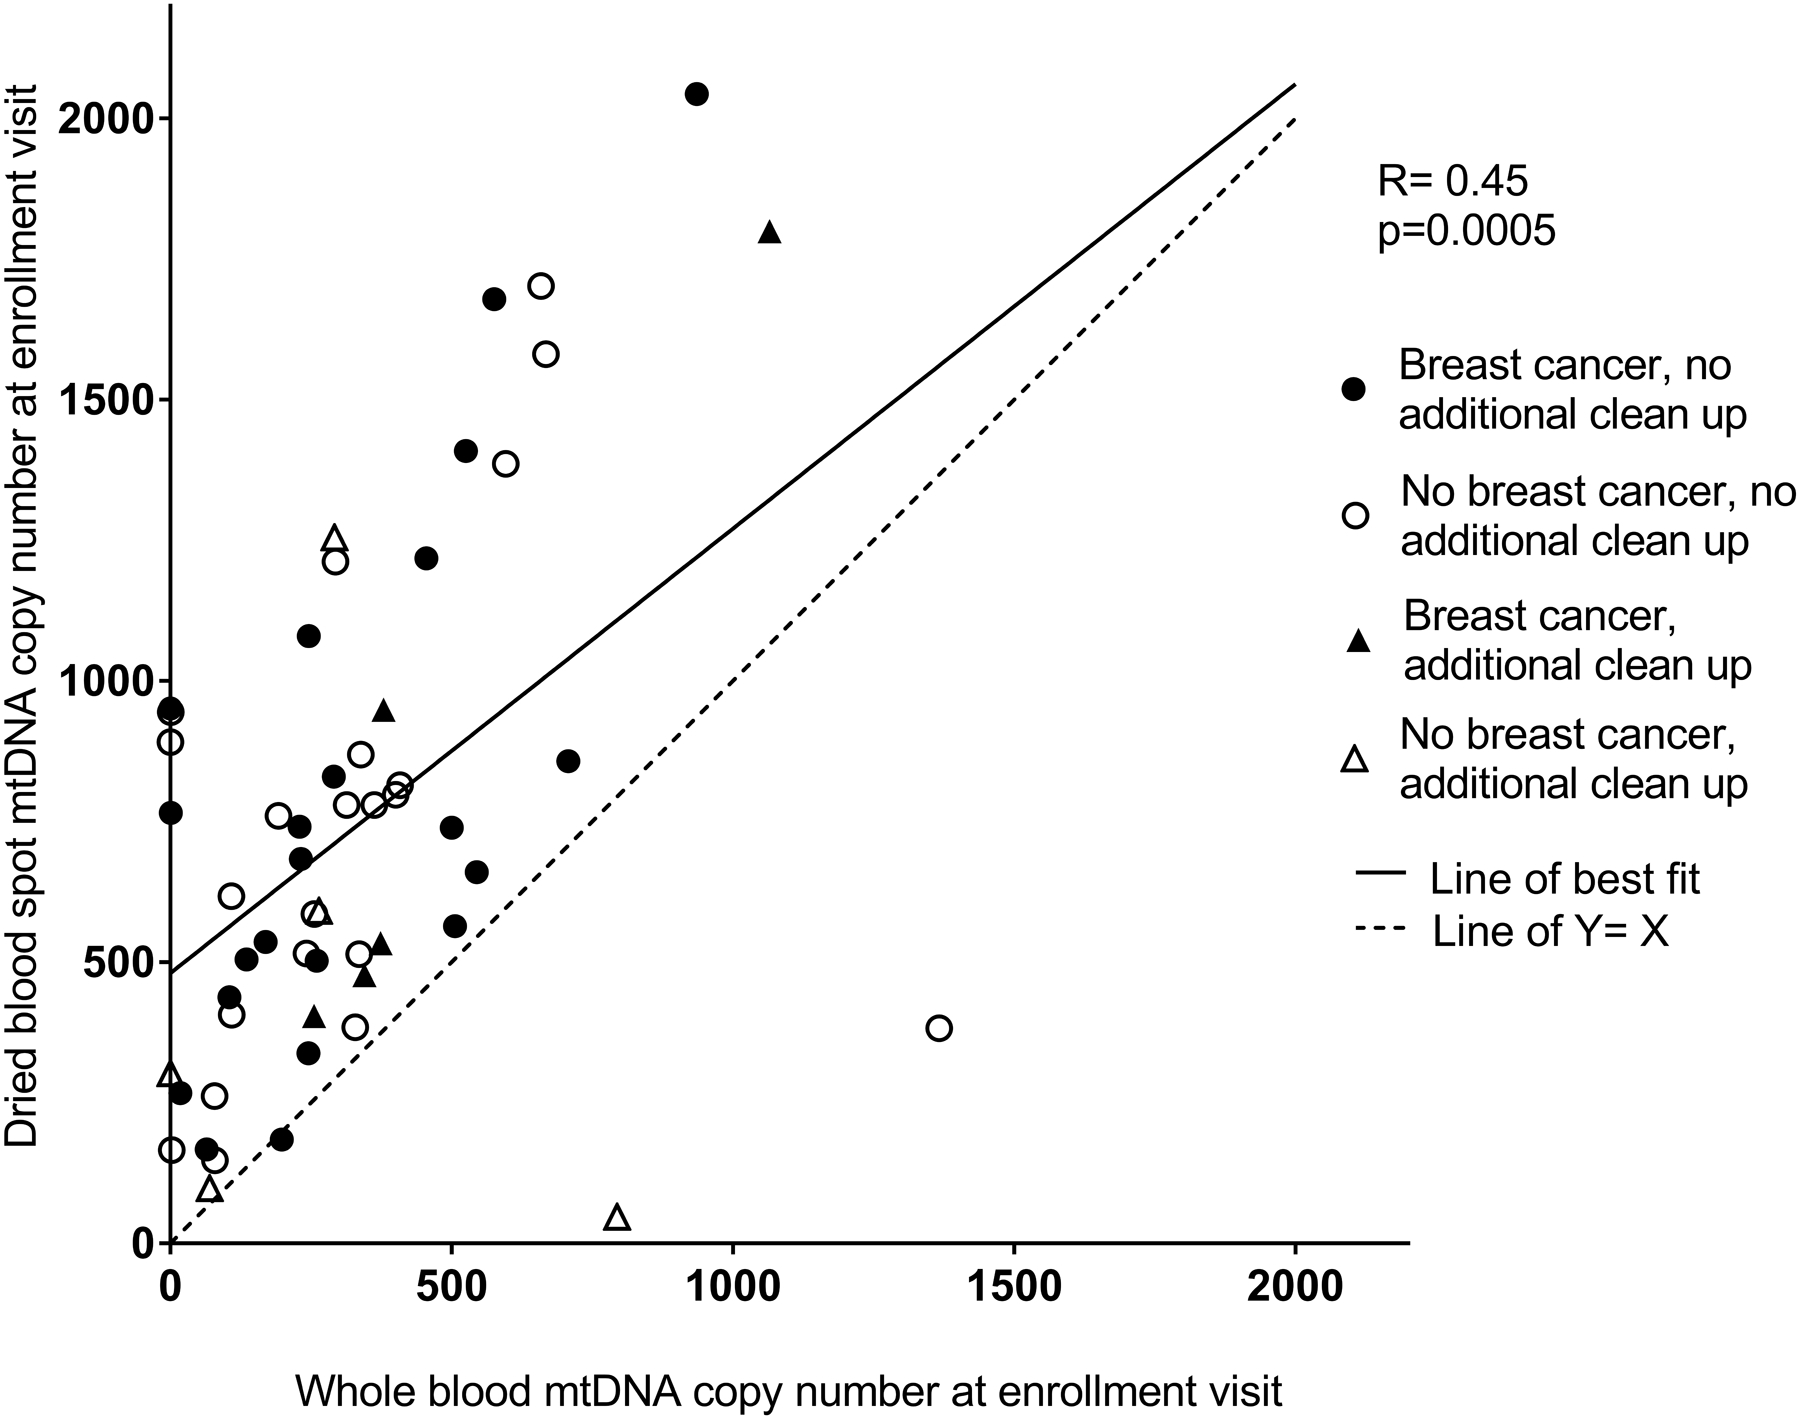
Comparison of mtDNA copy number from the whole blood sample from enrollment versus the dried blood spot sample from enrollment. Spearman correlation: R=0.45, p=0.0005. The coordinates of the two points below the line of Y=X are (794, 47) and (1367, 383) and are from women without a breast cancer diagnosis. Samples which required an additional clean-up step are indicated with triangles.