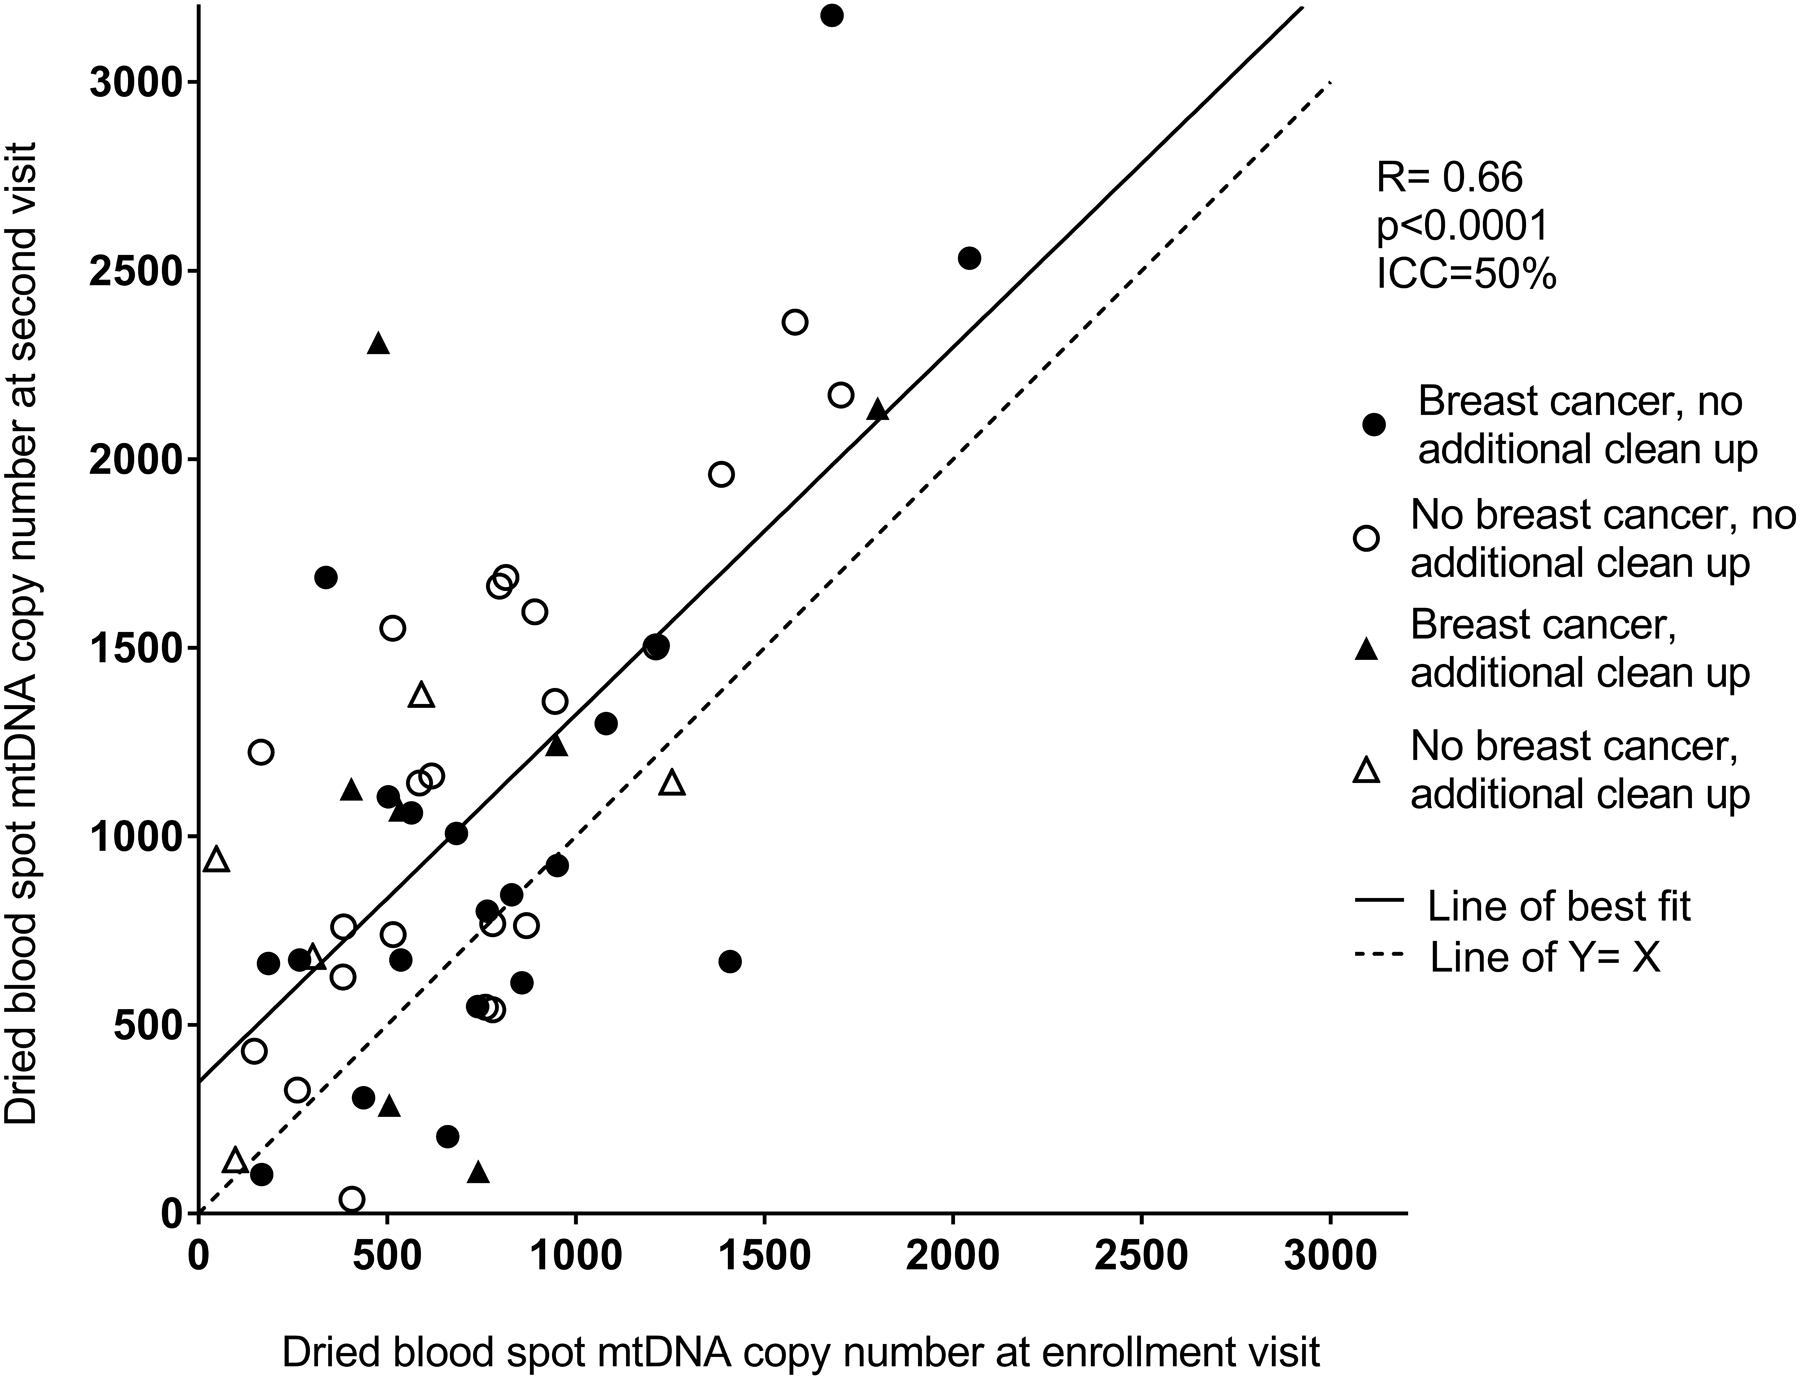
Figure 2.

Comparison of mtDNA copy number from the dried blood spot sample from enrollment versus the dried blood spot sample at the second visit. Pearson correlation: R=0.66, p<0.0001; Intra-class correlation coefficient=50%. Samples which required an additional clean-up step are indicated with triangles.
