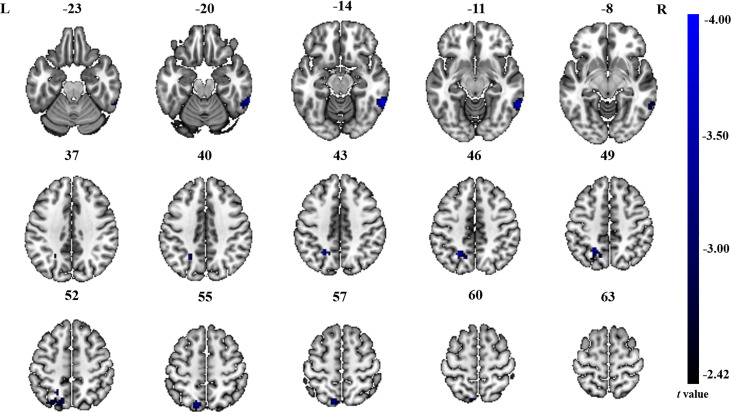
Figure 2. ReHo analysis.
Two-sample t-test results are presented. Areas in blue indicate significantly decreased ReHo value. In the comparison of ReHo value between ONFH patients and controls, ONFH patients showed significantly decreased ReHo in left superior parietal gyrus and right inferior temporal gyrus. ONFH, osteonecrosis of the femoral head; ReHo, regional homogeneity.

