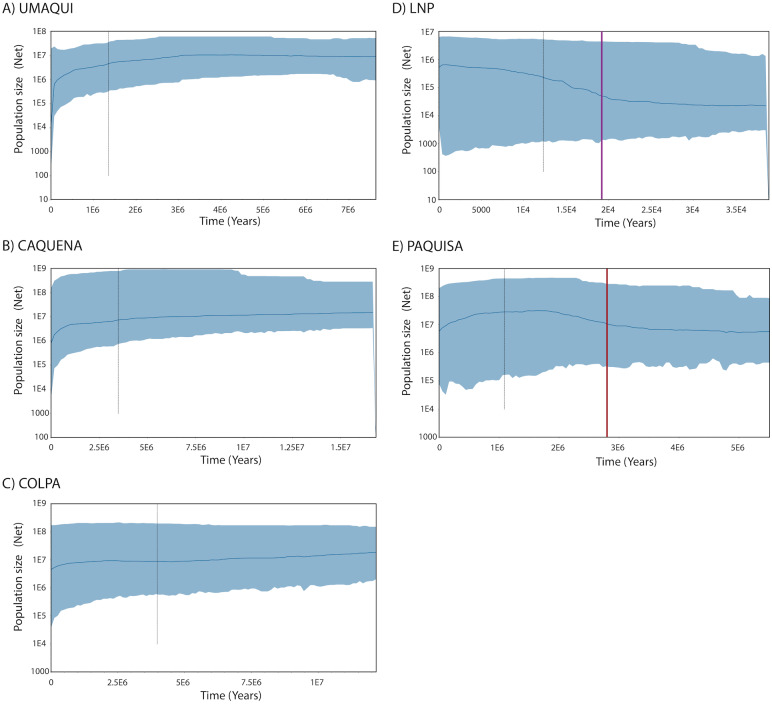
Figure 4. Demographic history from a Bayesian skyline plot analysis estimated using mitochondrial control region sequences of Orestias groups: (A) Umaqui, (B) Caquena, (C) Colpa, (D) LNP group and (E) Paquisa.
The x-axis shows the Time in years and y-axis shows the Population size as the product of effective population size (Ne) and generation time (t). The black solid line represents the median estimate of the estimated effective population size, and 95% highest probability density (HPD) interval corresponds to the shaded blue area. The segmented line corresponds to the estimated time of the most recent common ancestor (TMRCA) and the purple and red solid lines on (D) and (E) respectively correspond to the estimated time for the expansion of that populations.

