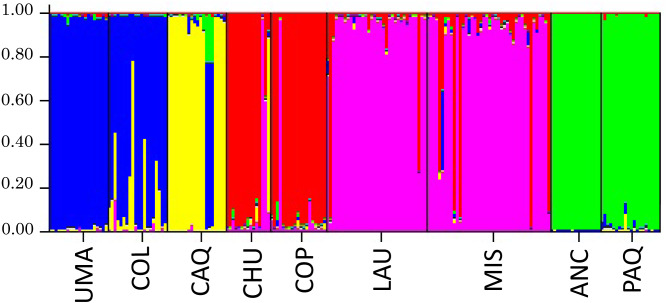
Figure 6. Results of the analysis of genetic structuring and cluster assignment (Structure) for all locations analyzed with k = 5.
Each vertical line represents an individual, grouped according to their place of origin separated by black lines. Each color corresponds to a genetic group. The different colors in each individual represent their probability of assignment to that genetic group.

