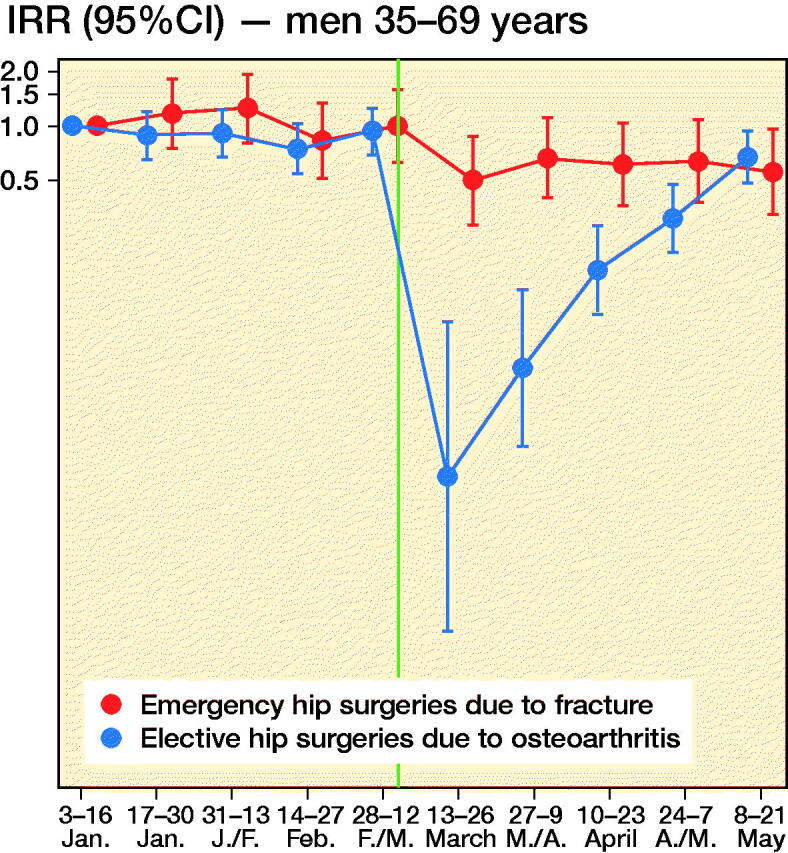
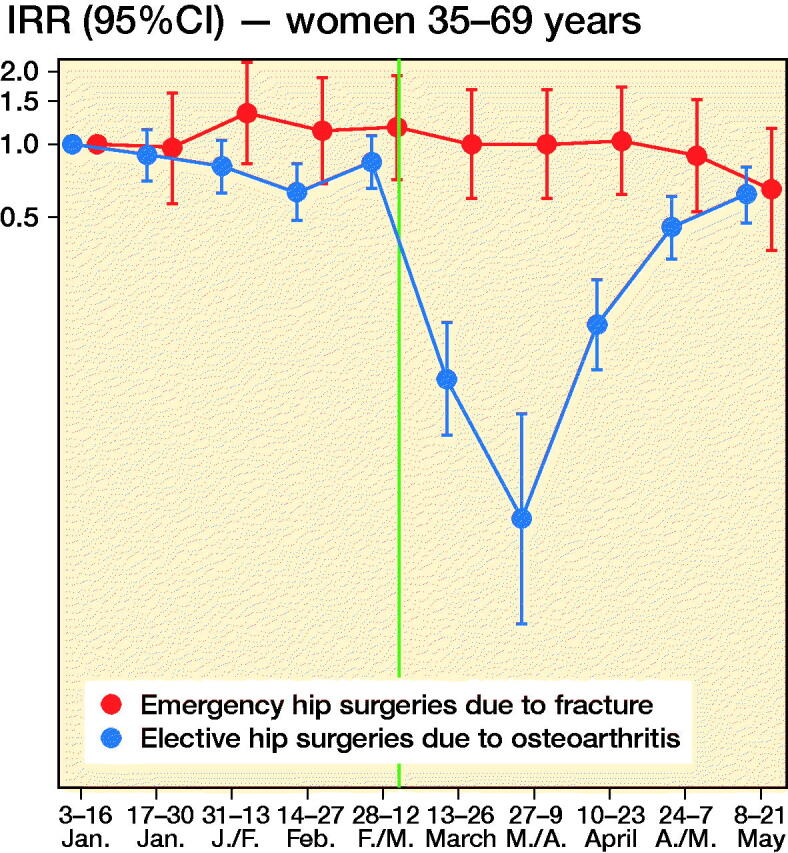
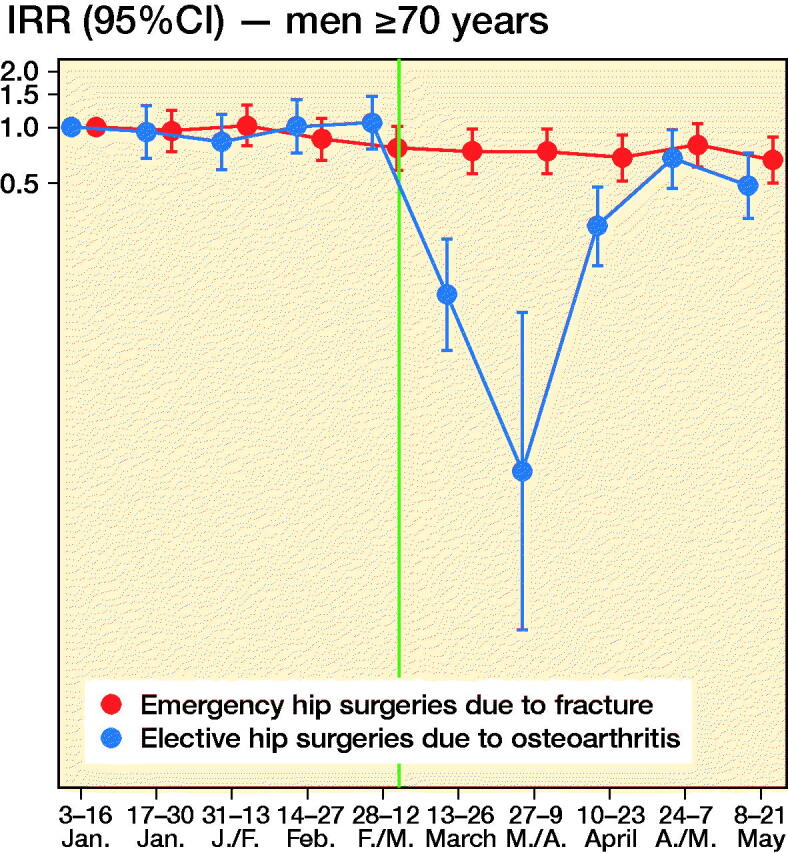
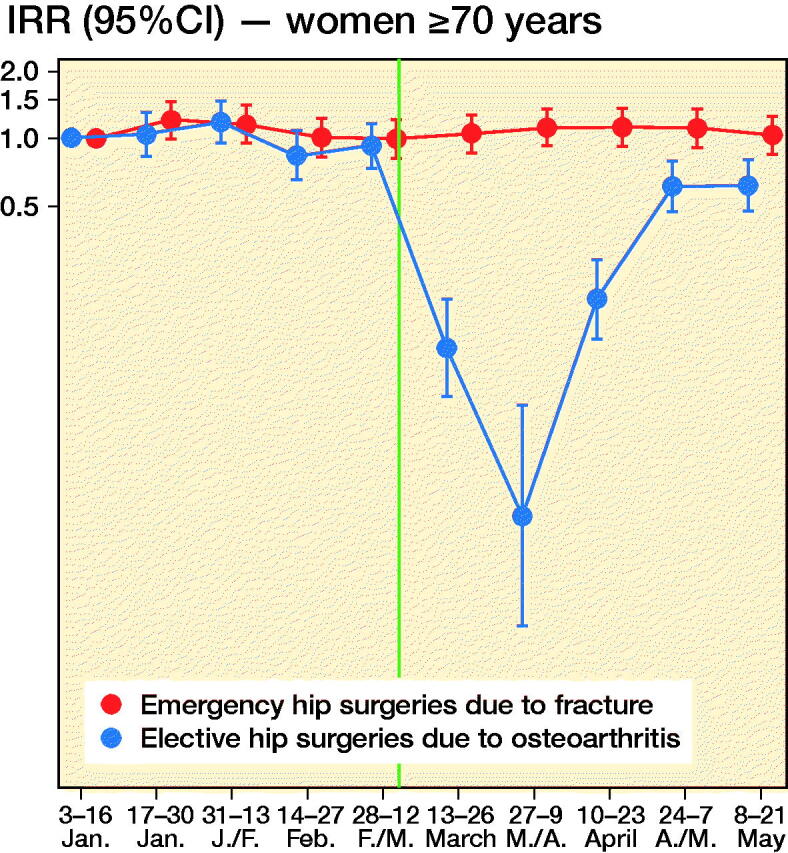
Figure 2.
Incidence rate ratios (y-axis, IRR) of emergency hip surgeries due to fracture (red) and the IRR of elective hip surgeries due to osteoarthritis (blue) in Norway, January 3, 2020–May 21, 2020 with January 3–January 16 as base level with 95% confidence intervals (CI). Red dots/line = emergency hip fracture surgeries. Blue dots/line = elective hip osteoarthritis surgeries. The red and blue 2-weekly dots are graphed next to each other for improved readability. Vertical line represents the national implementation of lockdown strategies on March 13, 2020.