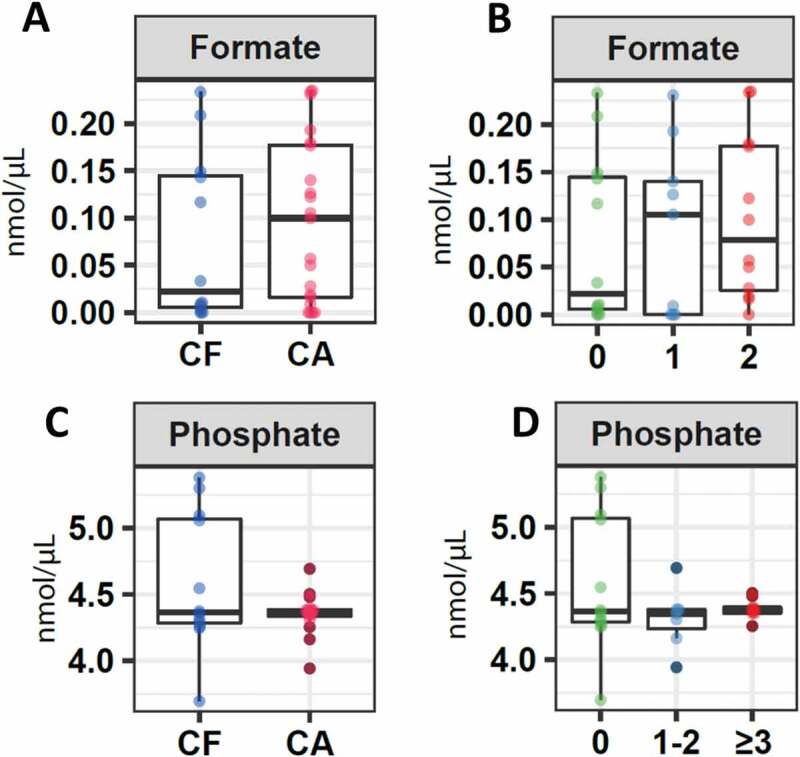
Figure 3.

Salivary concentration of molecules associated with the pH. Boxplots represent: A. Differential levels of formate in children without cavities (CF) and with cavities. B. Formate levels in children without caries (CF), children with ICDAS 1 and 2 (CA1), and children with ICDAS greater than 3 (CA2). C. Phosphate levels in children without cavities (CF) and with cavities (C). D. Phosphate levels in children without caries (CF), children with ICDAS 1 and 2 (CA1), and children with ICDAS greater than 3 (CA2)
