
Figure 1:
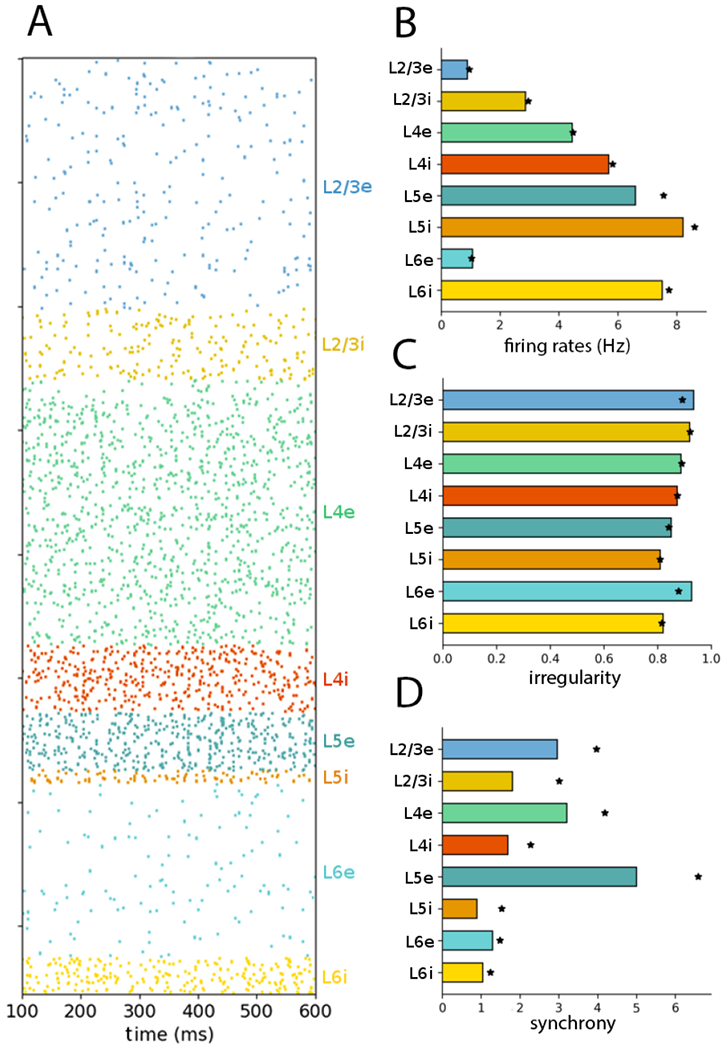
NetPyNE PDCM model with balanced Poisson inputs reproduces Fig. 6 of original article (Potjans and Diesmann, 2014a) (A) Raster plot showing activity of 1862 neurons for 500 ms. (B) Population mean firing rates over 60 s. (C) Population firing irregularity (CV ISI) over 60 s. (D) Population synchrony (normalized spike count variance over 5s). Statistics based on fixed sample of 1000 neurons/layer as in original model. Stars show statistics from Figure 6 of the original article.