
Figure 6:
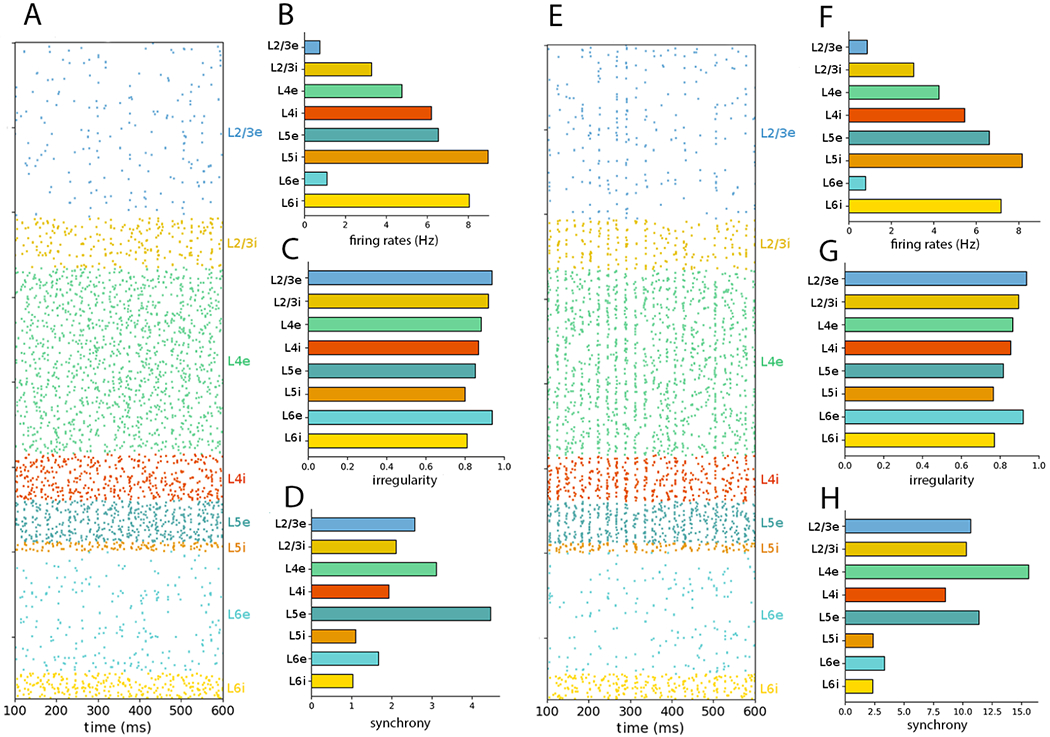
NetPyNE PDCM network rescaled to 10% of the number of neurons (A) Raster plot and (B–D) statistics for external Poisson input. (E) raster plot and (F–H) statistics for external DC current. The time interval and number of neurons sampled and plotted were chosen as in Figure 1.