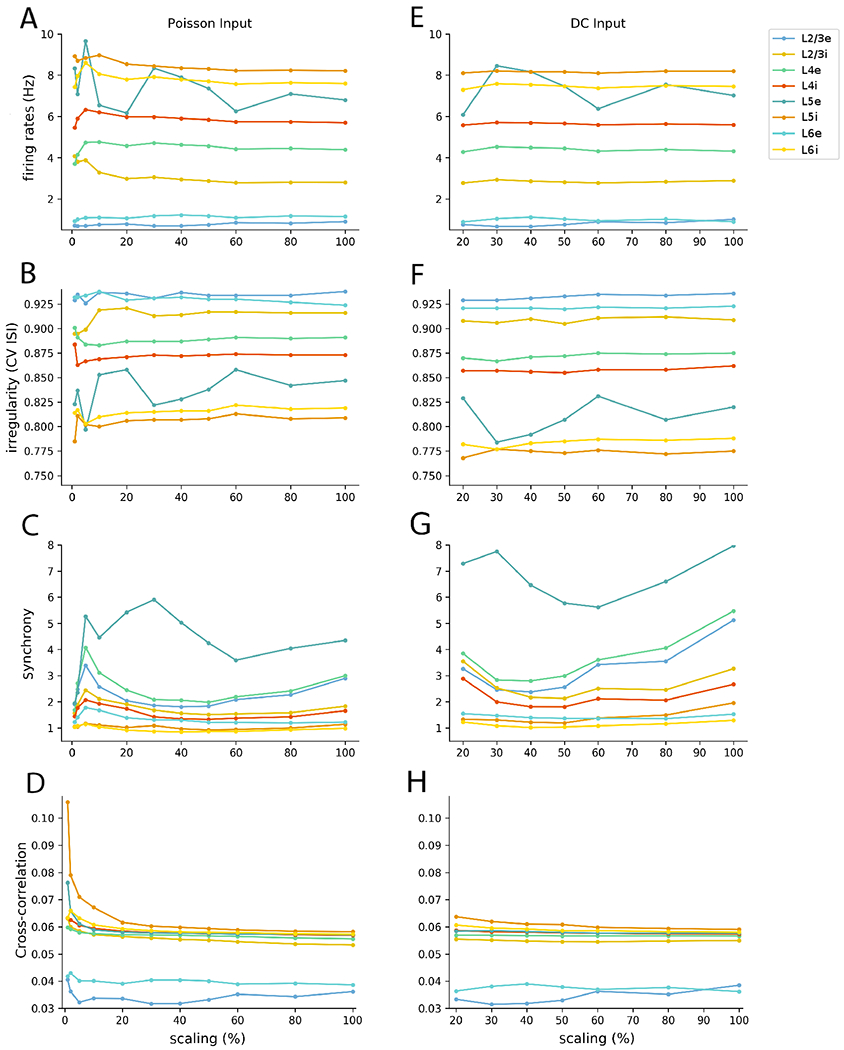
Figure 8:

Mean population firing rate (A,E), irregularity (B,F), synchrony (C, G) and cross-correlation (D, H) of the 8 cell populations as a function of scaling for the NetPyNE reimplementation of the PDCM model, with Poisson (left) versus DC inputs (right). All results were calculated from 60 s simulations and approximately 1000 neurons except for cross-correlation where all 2-neurons combinations were considered
