Figure 25.

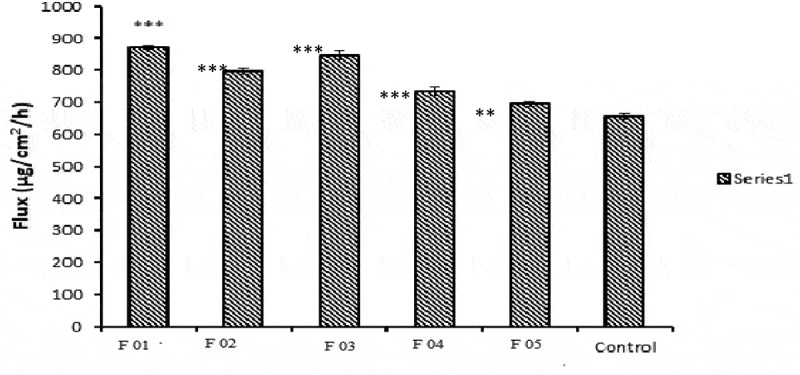
Permeation rate (flux) of three NE formulations in comparison with control. (*) represents significant difference of NE formulations flux from control

Permeation rate (flux) of three NE formulations in comparison with control. (*) represents significant difference of NE formulations flux from control